Daily Technical Outlook on Major - USD/CHF


Last Update At 10 Aug 2017 00:52GMT
Trend Daily Chart
Sideways
Daily Indicators
Rising
21 HR EMA
0.9654
55 HR EMA
0.9682
Trend Hourly Chart
Down
Hourly Indicators
Rising fm o/s
13 HR RSI
41
14 HR DMI
-ve
Daily Analysis
Consoldiation with downside bias
Resistance
0.9747 - Mon's high
0.9710 - Hourly sup (now res)
0.9693 - Y'day's European res
Support
0.9613 - Y'day's low
0.9595 - Hourly res (now sup)
0.9566 - 61.8% r of 0.9438-0.9773
-
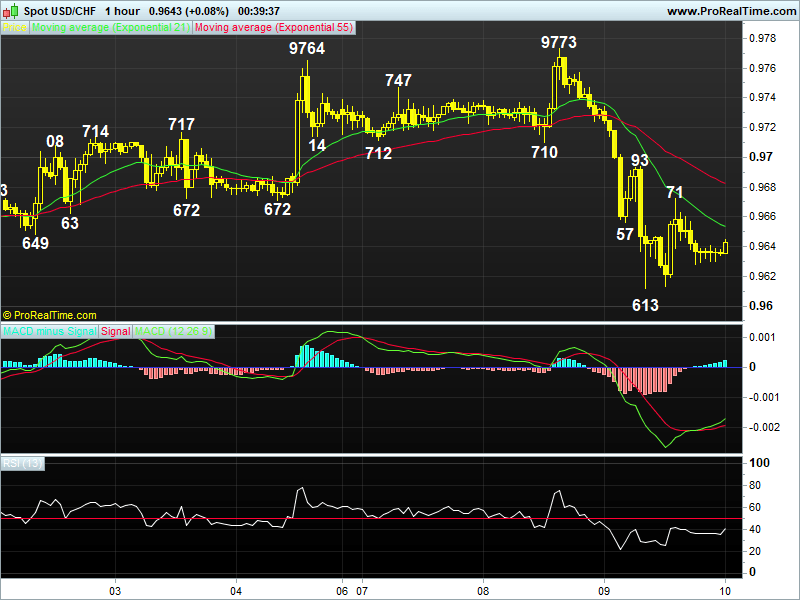
USD/CHF - 0.9644..Dlr tumbled to 0.9657 in Asia Wed on safe-haven buying of chf due to rising U.S.-N. Korea tensions. Price recovered to 0.9693 in Europe b4 dropping to session low of 0.9613 n later recovered to 0.9671 in NY morning.
-
Looking at the daily chart, despite dlr's early brief break of 2016 low at 0.9444 to a 22-month bottom of 0.9438 in Jul, subsequent cross-inspired rally abv 0.9553 (Jun' low) to 0.9793 on Tue confirms MT fall fm 1.0344 (2016 6-year peak in Dec) has made a low there as this lvl was also accompanied by 'bullish convergences' on the daily indicators. Having said that, y'day's selloff to as low as 0.9613 on risk aversion signals 1st leg of correction fm Jul's 22-month trough at 0.9438 has ended there n consolidation with downside bias would be seen for weakness to 0.9566, being the 61.8% retracement of aforesaid move but below sup at 0.9491 needed to indicate said correction fm 0.9438 is over.
-
Today, dlr's recovery to 0.9671 after y'day's selloff to 0.9613 would bring consolidation, reckon res at 0.9693 would cap upside n yield one more fall to 0.9595, however, as hourly indicators would display prominent 'bullish conver gences' on such move, reckon 0.9566 should hold. Abv 0.9710 may risk 0.9747.
Author

AceTrader Team
AceTrader
Led by world-renowned technical analyst Wilson Leung, we have a team of 7 analysts monitoring the market and updating our recommendations and commentaries 24 hours a day.


