|

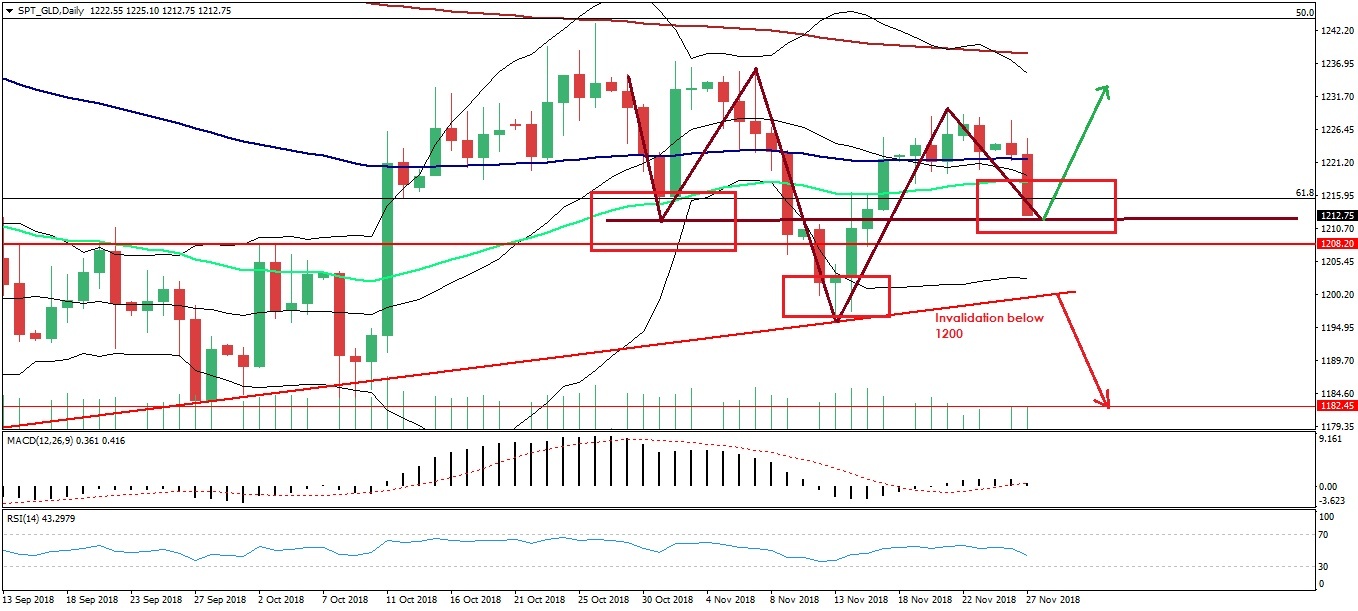
Daily Inverted head and shoulder pattern takes gold to form a bottom at 1212??

Gold Trading Opportunity: Gold on daily chart currently trading at 1213 fell from 1228, as shown in the chart technically forming a inverse head and shoulder pattern where currently forming a right shoulder which the base should be around 1212-1214., If the day holds or close above 1213 can see a sharp rise till 1233 upside which the pattern will complete. A break can see a rise till 1260 as per pattern calculation. Overall we adivse to buy or add the positions from here to upside 1233 and invalidation of this pattern can be seen when it close below 1200 on closing basis. 

Suggestion: Buy Gold from 1212-1214 FOR 1233 STOPLOSS COULD BE 1198

Gold

Author

Rajesh Tatineni

Rajesh Tatineni

BSH Advisory

Expert in commodity and forex markets, Rajesh Tatineni carries a wide experience and vast knowledge of various financial instruments. He's been involved in financial markets since 2010.

More from Rajesh Tatineni
Share:

Editor's Picks

EUR/USD recedes to daily lows near 1.1850

EUR/USD keeps its bearish momentum well in place, slipping back to the area of 1.1850 to hit daily lows on Monday. The pair’s continuation of the leg lower comes amid decent gains in the US Dollar in a context of scarce volatility and thin trade conditions due to the inactivity in the US markets.

GBP/USD resumes the downtrend, back to the low-1.3600s

GBP/USD rapidly leaves behind Friday’s decent advance, refocusing on the downside and retreating to the 1.3630 region at the beginning of the week. In the meantime, the British Pound is expected to remain under the microscope ahead of the release of the key UK labour market report on Tuesday.

Gold looks inconclusive around $5,000

Gold partially fades Friday’s strong recovery, orbiting around the key $5,000 region per troy ounce in a context of humble gains in the Greenback on Monday. Additing to the vacillating mood, trade conditions remain thin amid the observance of the Presidents Day holiday in the US.

Bitcoin consolidates as on-chain data show mixed signals

Bitcoin price has consolidated between $65,700 and $72,000 over the past nine days, with no clear directional bias. US-listed spot ETFs recorded a $359.91 million weekly outflow, marking the fourth consecutive week of withdrawals.

The week ahead: Key inflation readings and why the AI trade could be overdone

It is likely to be a quiet start to the week, with US markets closed on Monday for Presidents Day. European markets are higher across the board and gold is clinging to the $5,000 level after the tamer than expected CPI report in the US reduced haven flows to precious metals.

XRP steadies in narrow range as fund inflows, futures interest rise

Ripple is trading in a narrow range between $1.45 (immediate support) and $1.50 (resistance) at the time of writing on Monday. The remittance token extended its recovery last week, peaking at $1.67 on Sunday from the weekly open at $1.43.