Cycle Trading: Natgas Crosses The Line

Natgas lost the 50 day MA back in December of 2018. Since then it has been contained by the 50 day MA -- Until Thursday
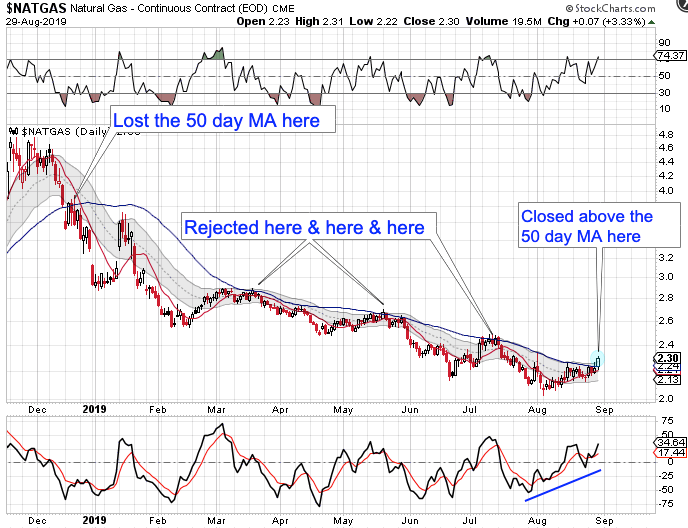
Since losing the 50 day MA back in December, 2018 Natgas has been in a daily downtrend. This downtrend has been characterized by lows forming below the lower daily cycle band and highs printing below the upper daily cycle band. So not only did Natgas closing convincingly above the 50 day MA on Thursday, it also closed above the upper daily cycle band. This ends the daily downtrend and begins a daily uptrend.
In the Weekend Updates I plan to break down the daily, weekly, and yearly cycle which will indicate that Natgas is finally emerging from its yearly cycle low.
Author

LikesMoney
Independent Analyst
Assets (such as stocks, gold, and the dollar) have identifiable cycles.


