Crude Oil – Who Wants the Triangle?

On Thursday crude oil wavered between small gains and losses, but finished the day only 23 cents above Wednesday closing price. Such small daily changes that we observe recently don’t look too encouraging for oil bulls or for the bears. However, to dispel boredom, we rummaged deeper in the charts and we found something that may interest both sides of the market’s battle. Curious?
Nevertheless, before we get to our little surprise, we would like to draw your attention to news from the IEA. Yesterday, the International Energy Agency said that global oil supply increased by 700,000 barrels per day from a year ago in the previous month. Additionally, we find out that supplies from producers outside of the OPEC will grow by 1.8 million bpd this year versus an increase of 760,000 bpd last year (mainly due to the rapidly growing production in the U.S.).
Such information (especially in connection with the previous reports from this month about which you could read in our March alerts) doesn’t bode too well for higher prices, increasing worries that rising supply from the U.S. and other nations could spoil efforts made by OPEC and other producers to tighten the market.
Is the fundamental picture of crude oil the only one who suggest that the lower prices are just around the corner? Let's take a closer look at the charts below to find out.
Technical Analysis of Crude Oil
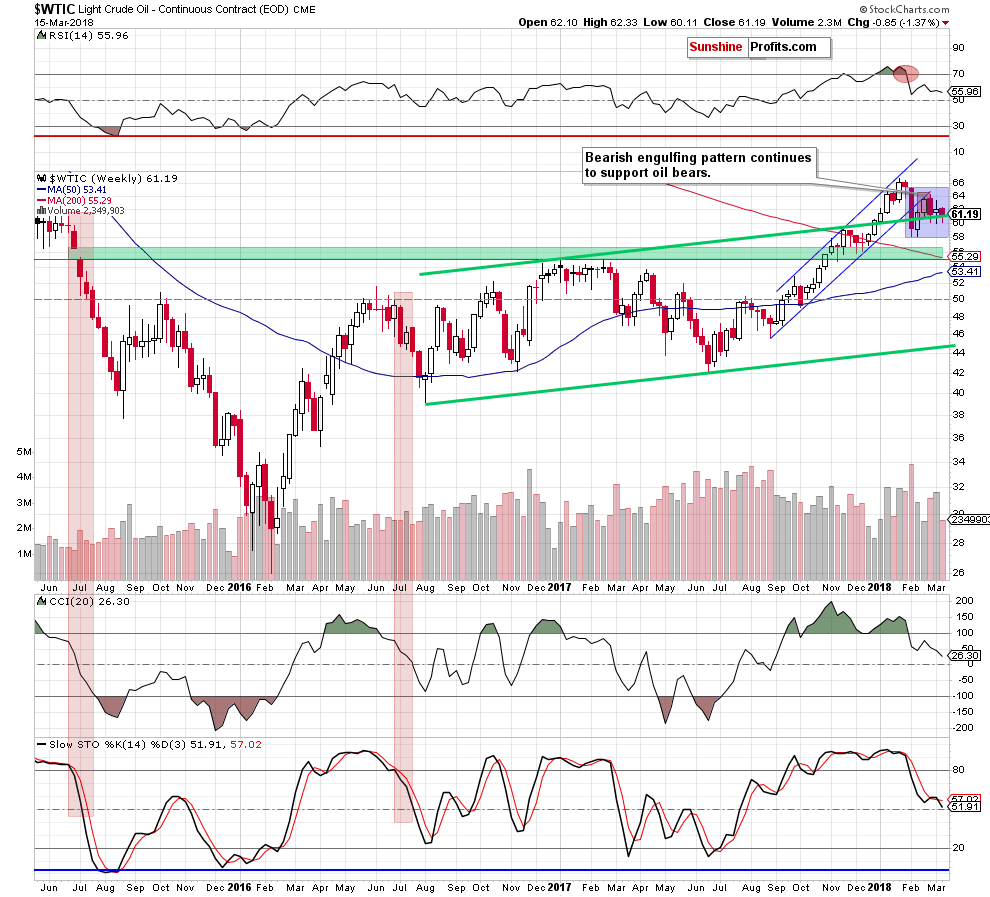
Looking at the medium-term picture of the commodity, we see that the situation remains almost unchanged as the previously-broken upper border of the green rising trend channel continues to keep declines in check. Additionally, black gold is still trading in the blue consolidation, which raises the importance of this area for both sides of the market.
Nevertheless, the sell signals generated by all indicators remain in the cards, supporting the sellers as well as the bearish engulfing pattern, which strengthens the blockade of the road to the north.
So, if the medium-term picture may raise some doubts about the direction of the next bigger movement, is it possible that the short-term changes give us credible hints about the future of crude oil? Let's check it.
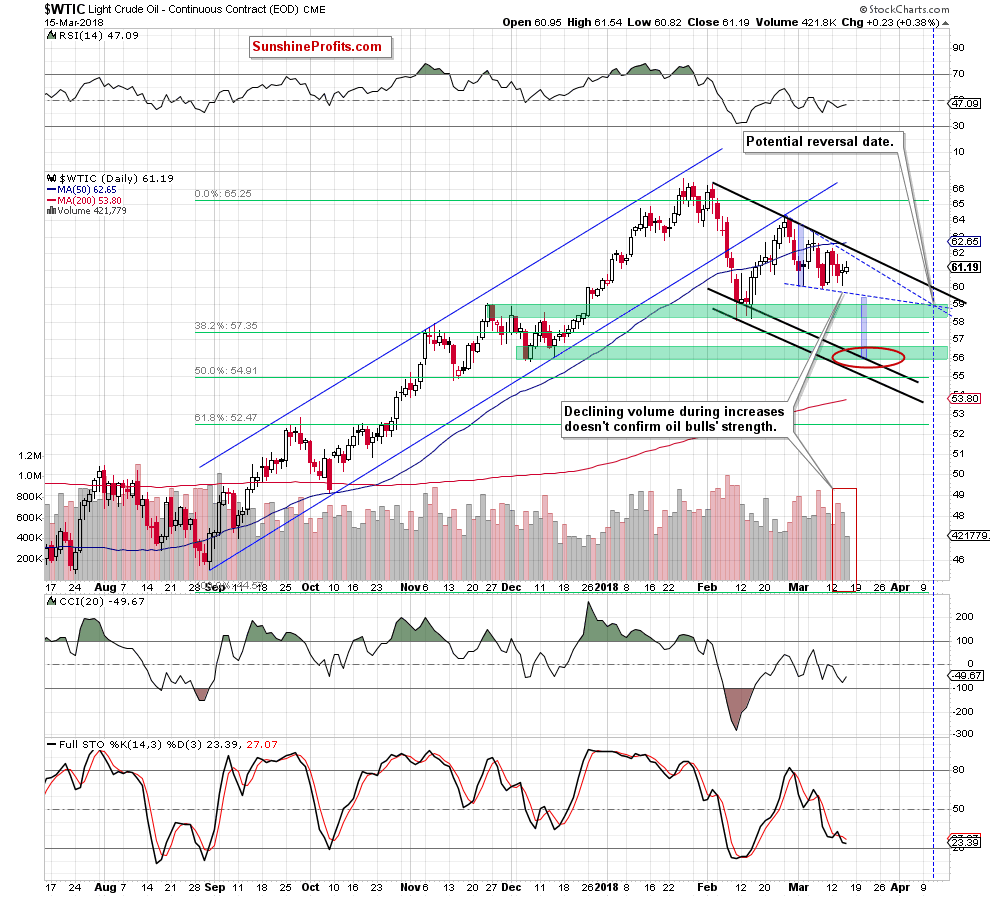
At the first glance, we could write that the situation doesn’t look much better from this perspective, because crude oil still remains in a very short-term consolidation between the barrier of $60 and the black declining resistance line based on the previous highs (a potential upper border of declining trend channel), which is currently reinforced by the previously-broken 50-day moving average.
After this extended sentence, you could ask: “so… that's all you have to say?” We would not be surprised by, for example, such a comment: “I’m not interested in these two consolidations, I want to know what will happen next!”
Before negative emotions arise, please pay attention to the beginning of the first sentence under the chart... at the first glance…
You know us for a long (or short) time and you know that we would not be ourselves if we did not dig deeper in the charts to come up against your questions and doubts. So, instead of complaining about consolidations, let's take a closer look at the bullish and the bearish arguments.
What the buyers have on their side? Two important supports: the above-mentioned, previously-broken upper border of the green rising trend channel and the barrier of $60.
What weapons do their opponents have at the moment of writing these words?
Six Reasons Why Oil Bears Could Win
The first one is the verification of the breakdown under the lower border of the blue rising trend channel, which triggered a decline to the level of $60.
The second is the proximity to the above-mentioned black declining resistance line based on the previous highs and the 50-day moving average.
The third is declining volume during recent increases. As you see the history repeats itself once again, indicating that the upward move not supported by the increasing volume may end with reversal once again.
The fourth is the re-generated by the Stochastic Oscillator sell signal. When we take a closer look at the daily chart, we notice that this is a repeat what we already saw on March 7. What happened in the following days? The price of crude oil extended losses, re-testing the barrier of $60.
The fifth is the long-term picture of crude oil. Let’s examine the monthly chart.
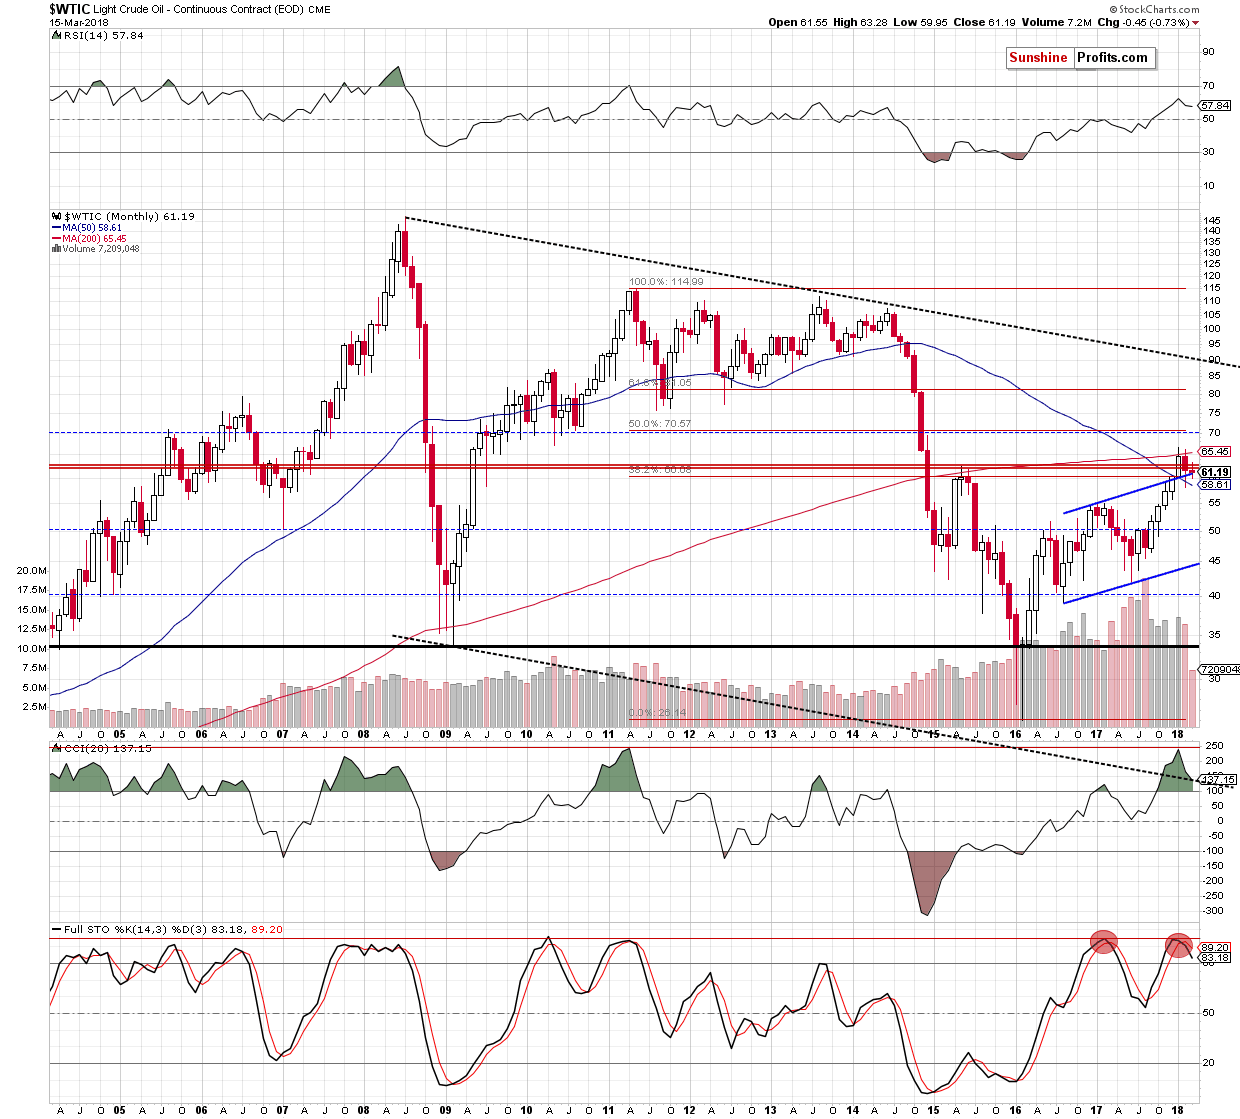
From this perspective we see that crude oil is trading not only under the May 2015 peak and the 200-month moving average, but also slipped below the 38.2% Fibonacci retracement.
Additionally, the sell signal generated by the Stochastic Oscillator continues to support the bears. What’s interesting, the last time when we saw such situation was a year ago. Back then, the sell signal preceded a bigger decline, which took crude oil to almost $42 in the following months.
But returning to the bear arguments… we found something else.
The sixth argument is the similarity to the past.
What do we mean by that? Looking at the daily chart, you probably noticed a blue triangle, which limits the price fluctuations since the beginning of the month. At this point, you should remember that the triangle is first of all an example of consolidation, and each consolidation causes the market to wait for a good moment to enter. After clear movement, prices fluctuate up and down, and investors are eagerly awaiting the opportunity to start another strong wave of purchases or sales.
If you are interested a bit more in technical analysis, you probably read that triangles can be formations of continuation or reversal of the trend - depending on the context (starting from the direction of the triangle, through indicators and ending with the general fundamental situation on the market). We, however, examined them from a completely different side.
Mambo No.5? No, Triangle Number 5
Have you ever heard about the triangle apex reversal? That’s the name for a littleknown, but effective and useful technique for detecting reversals. Some time ago, we tested it on the precious metals market and today we would like to show you how triangles work on crude oil charts.
Let’s take a look at the daily chart once again, but this time from a wider perspective.
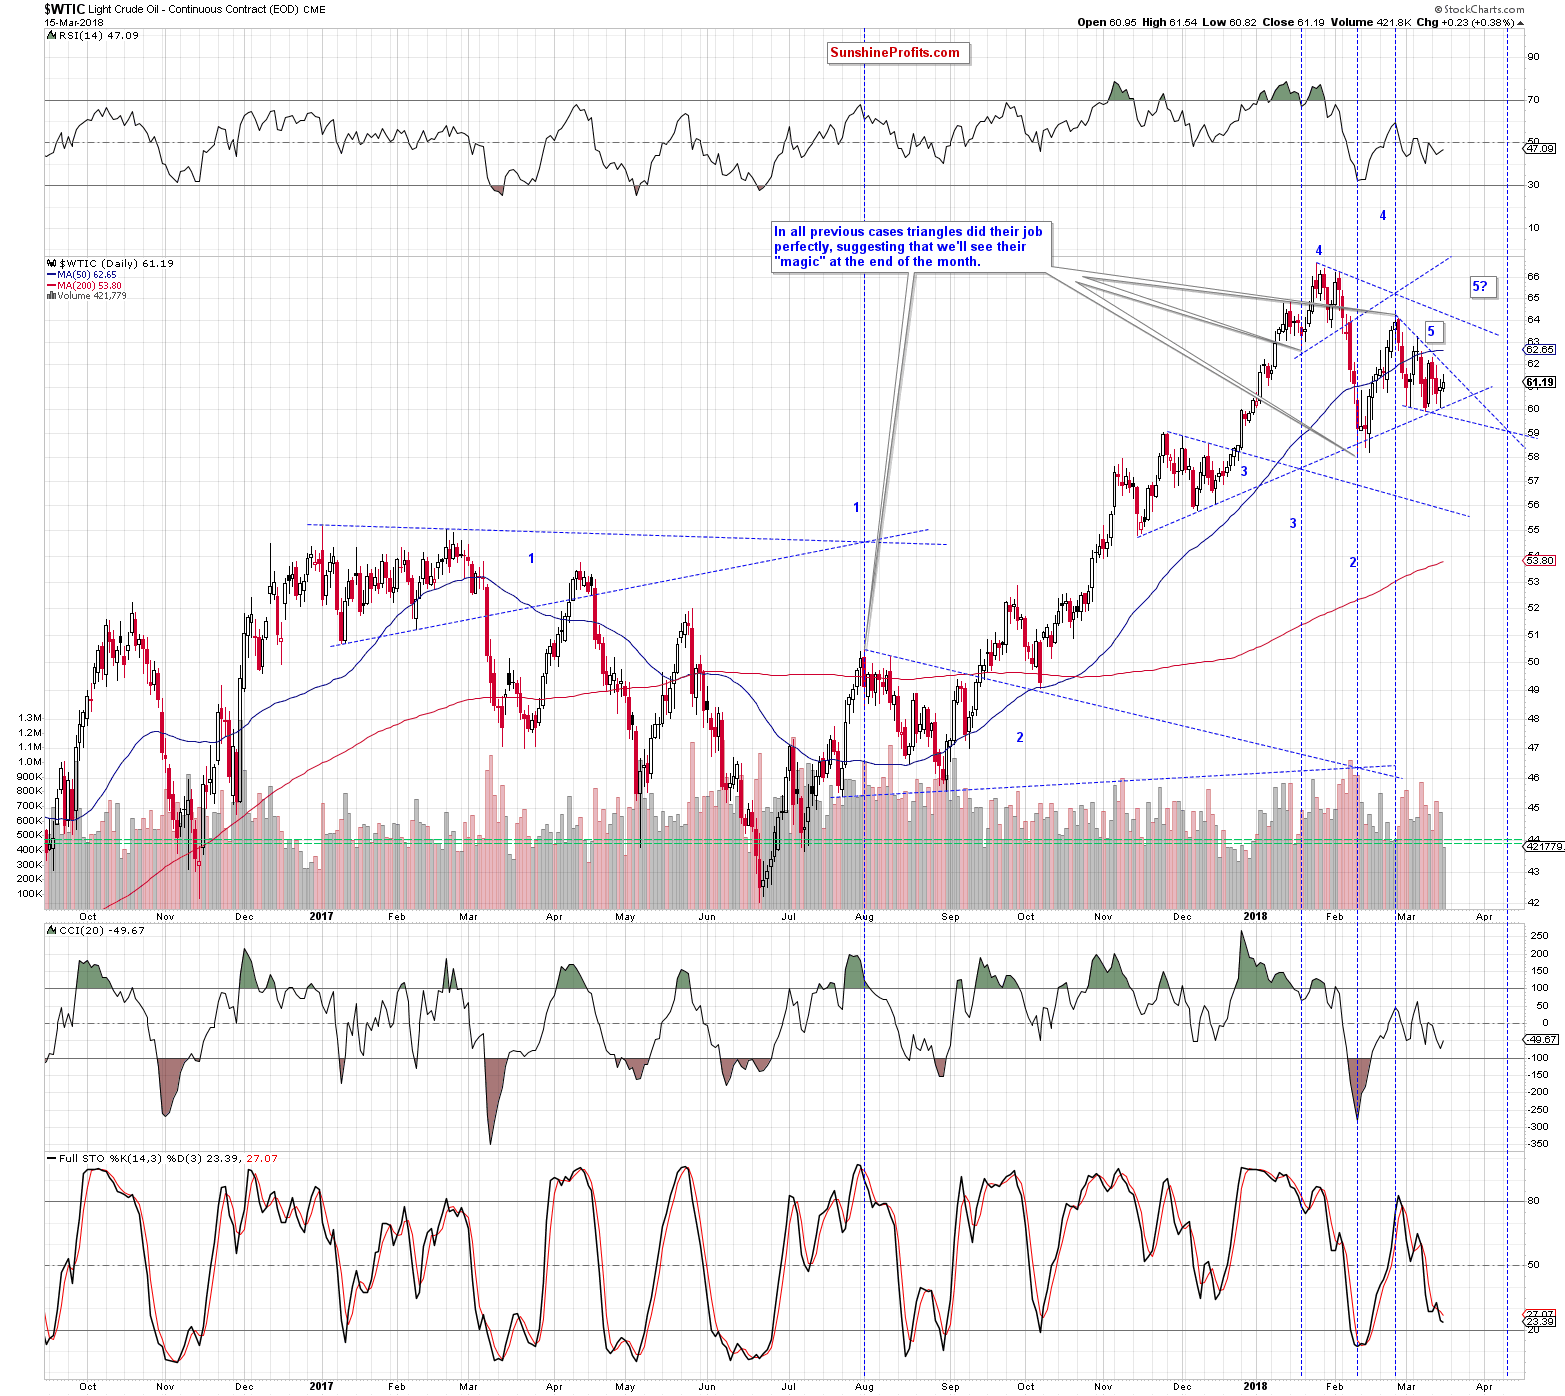
As you see on the above chart the first triangle was created at the beginning of the previous year by the resistance line based on the January and February 2017 highs and the support line based on the January and February lows. Where did they intersect?
Around the beginning of August 2017, which resulted in a reversal and a bigger move to the downside, which pushed the price of the commodity lower and lower throughout the month.
The second triangle was based on the resistance line created by the August 207 peaks and the support line created by the late July and August 2017 lows. This time the intersection of these lines occurred on February 9 and translated into the rebound, which we observed for most of the previous month.
Another example? Here you are. The triangle number 3. It was created by the resistance line based on the November and mid-December highs and the support line based on the mid-November and early December lows. Where did these lines cross? On January 19 and triggered the final wave of the crude oil’s rally.
The triangle number 4 was smaller than its predecessors, but it worked, indicating that the reversal will take place around February 26.
After this short trip to the past, it's time for the above-mentioned blue triangle, which you saw on the first daily chart. What does its presence on the chart mean for crude oil? No less no more than the fact that if history repeats itself once again, the intersection of its lines will take place around April 10.
The most interesting is that this date is confirmed by two more triangles, which we found on the weekly chart. See for yourself.
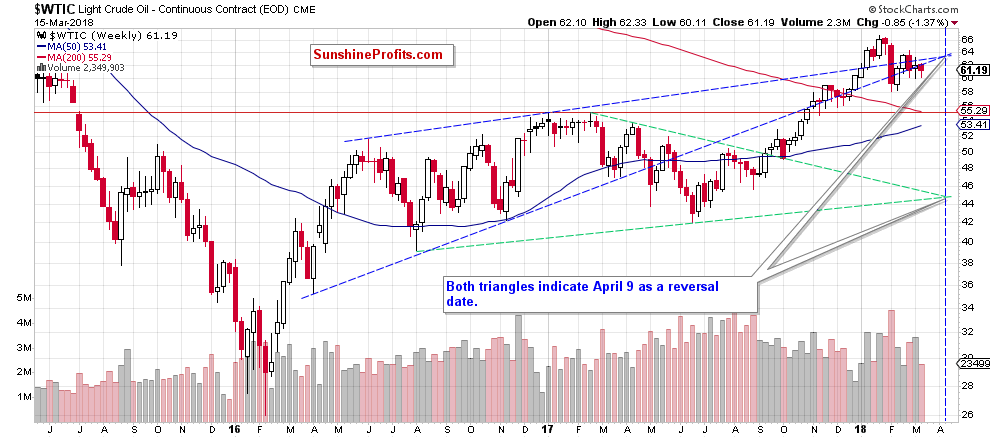
From this perspective, we see that the blue triangle is created by the resistance line based on the June 2016 and January 2017 peaks and the support line based on the April 2016 low and mid-November 2016 low. The green triangle is created by the resistance line based on the February and April 2017 highs and the support line based on the August 2016 and June 2017 lows.
Additionally, analyzing the above chart, we noticed that April 4, 2016 and April 10, 2017 brought reversals, which increases the probability that we’ll likely similar price action in the coming month.
Will April 9, 2018 show the short-term bottom or the top? At the moment of writing these words, we can’t be absolutely sure as there are no sure bets in any market, only bigger and smaller chances of something working. Nevertheless, all the abovementioned fundamental and technical factors clearly show that oil bears have more arguments on their side, which should translate into further deterioration in the coming week(s).
So how low could black go if we see a realization of the bearish scenario?
If the commodity extends losses and breaks under the lower line of the triangle, the first downside target will be February lows around $58. If they are broken, oil bears will likely push the commodity to December or November 2017 lows (we marked this area with the red ellipse). If they do not stop declines, the next downside targets will be around $53.50-$53.65, where the April 2017 peaks and the 61.8% Fibonacci retracement are. At this point it is worth noting, that this area will be likely reinforced also by the lower border of the black declining in the coming week(s).
Want free follow-ups to the above article and details not available to 99%+ investors? Sign up to our free newsletter today!
Author

Nadia Simmons
Sunshine Profits


