Crude Oil – Precious Metal Link

Trading position (short-term; our opinion): Short positions (with a stop-loss order at $54.51 and initial downside target at $45.43) are justified from the risk/reward perspective.
On Tuesday, crude oil moved lower and lost 1.66% after data showed that OPEC production rose to about 34.2 million barrels per day in Nov, hitting another record high. In this environment, light crude slipped under $51 and approached the barrier of $50, and thus the short position that we had opened early during yesterday's session were already profitable at its end. Will we see a drop below the key $50 level in the coming days?
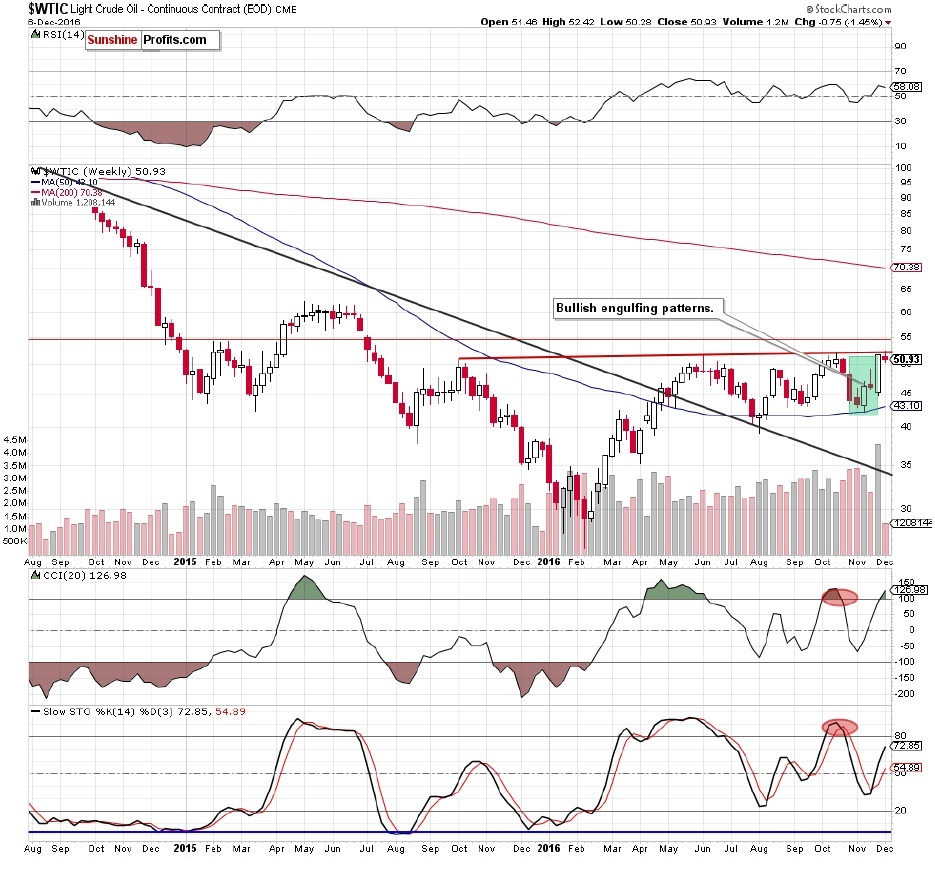
(...) the commodity pulled back, which took the price not only under the previously-broken Oct peak, but also below the upper border of the blue rising trend channel, which means an invalidation of earlier breakouts.
Such price action doesn't bode well for the commodity – especially when we factor in the fact that yesterday's increase materialized on a smaller volume once again (as a reminder, the size of volume that accompanied recent increases (since Wednesday) has steadily decreased, which suggests that the rally is running out of steam). Additionally, the CCI and Stochastic Oscillator climbed to the highest levels since Oct, which increases the probability of reversal in the coming days.
From today's point of view, we see that oil bears pushed the commodity slightly lower as we had expected. With this move, light crude dropped to the previously-broken red rising support line (based on the Aug and Sep lows), approaching the Friday's low and the barrier of $50.
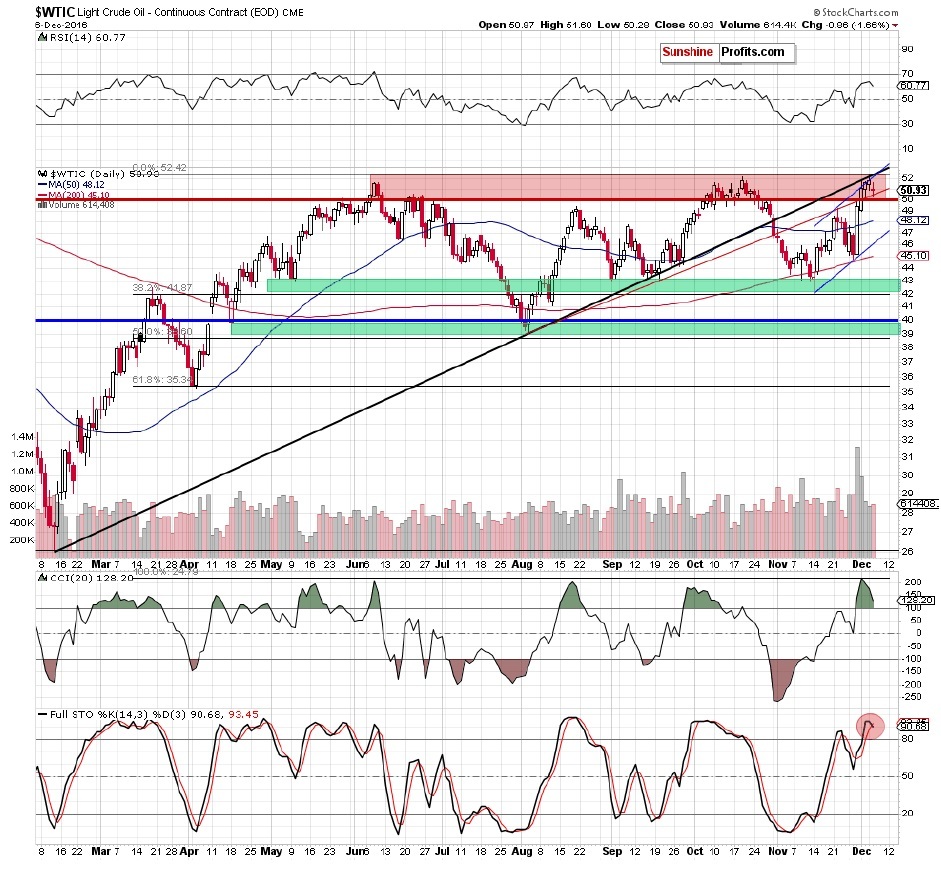
When we take a closer look at the daily chart, we notice that this area encouraged oil bulls to act at the end of the previous week, which suggests that we may see a rebound later in the day. Nevertheless, even if we see such price action, we should keep in mind that invalidation of the breakout above the Oct high continues to have bearish implications and so do other factors: the rising, medium-term black resistance line and the upper border of the blue rising trend channel. Therefore, we believe that as long as there is no confirmed breakout above the combination of the above-mentioned solid resistance levels, all upswings will be nothing more than a verification of earlier breakdown.
Additionally, the Stochastic Oscillator generated a sell signal (we will view the signal as confirmed once it moves below the 80 level, but the implications of indicator's move below its red signal line are already bearish) and the size of volume increased slightly during yesterday's decline, which in combination with the picture that emerges from the oil-to-gold and oil-to-silver ratios raises doubts about the continuation of the recent rally in the coming days.
When we take a look at the chart below, we see that the oil-to-gold ratio moved lower, which means that what we wrote yesterday is up-to-date also today:
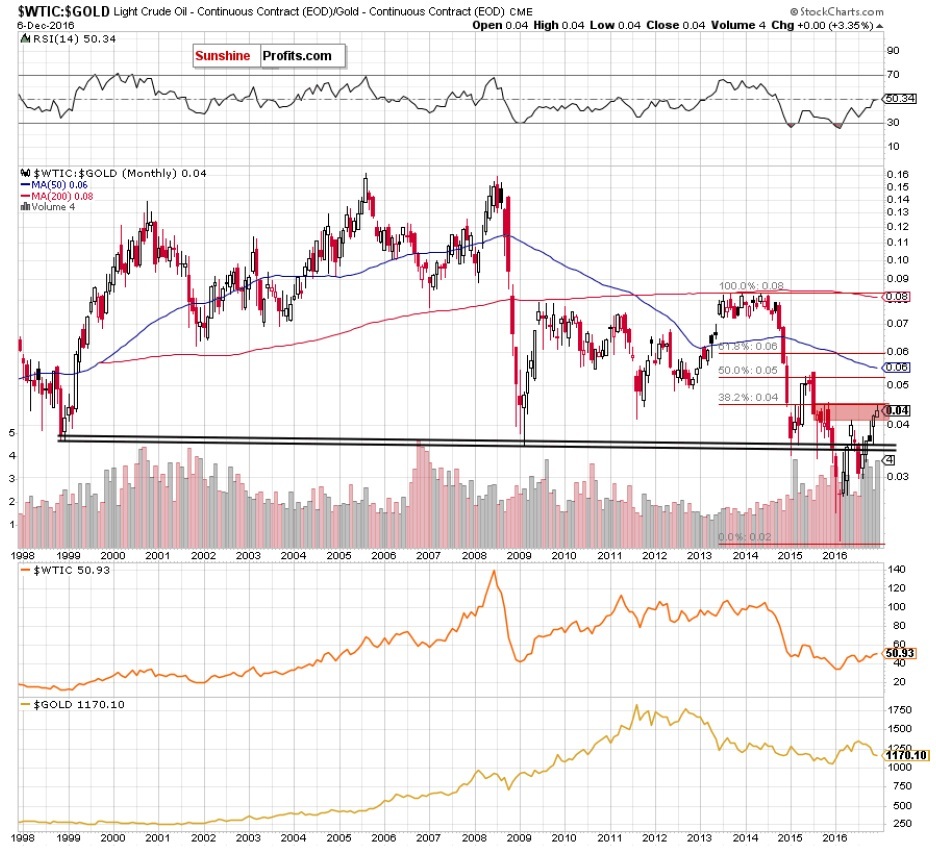
On the long- and medium-term charts, we see that the ratio reached the upper border of the red zone, which is the key resistance at the moment. Therefore, even if we see another attempt to move higher, in our opinion, the space for gains seems limited as the late 2015 highs and the 38.2% Fibonacci retracement (based on the 2013-2016 downward moves) are very close to the current position of the ratio. As you see, this area was strong enough to stop increases in May and also in Oct, which suggests that we may see similar price action in very near future.
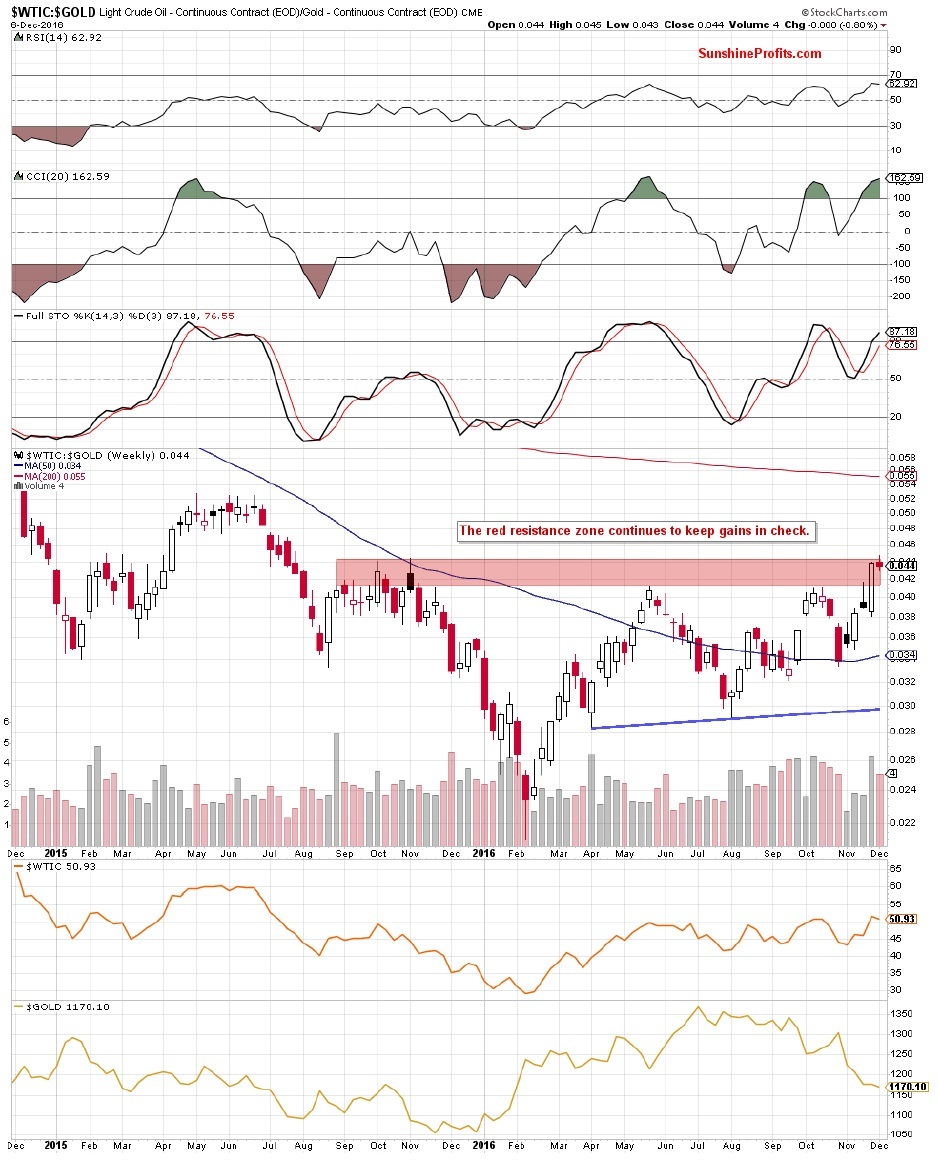
Additionally, this scenario is also supported by the very short-term picture.
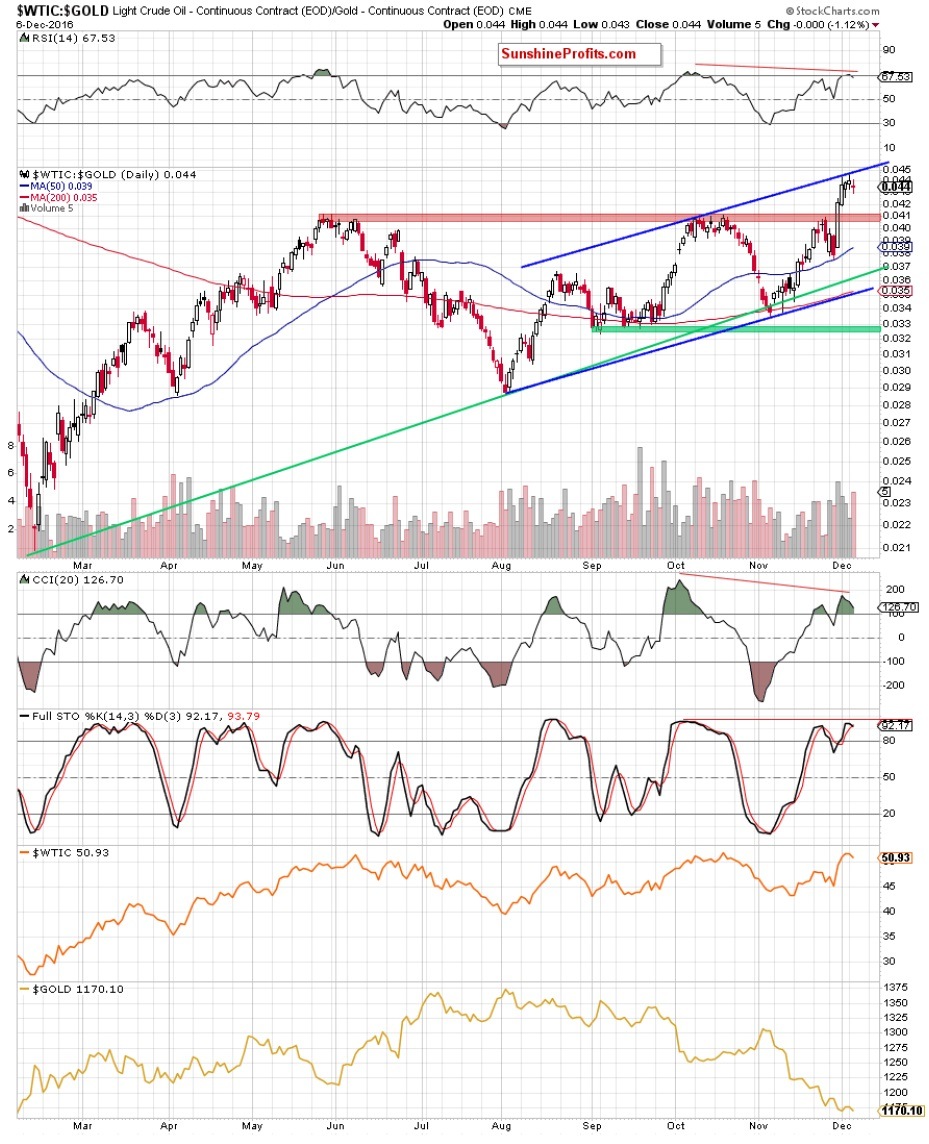
From this perspective, we see that the oil-to-gold ratio climbed to the upper line of the blue rising trend channel, which in combination with the current position of the indicators (the RSI moved above the level of 70 and there are negative divergences between all indicators and the ratio) and decreasing volume during recent increases suggests that reversal and lower values of the ratio are just around the corner.
What does it mean for crude oil? Taking into account a strong positive correlation between the ratio and the commodity, we believe that lower prices of black gold are very likely in the coming week(s).
If this is the case and we see a correction of the recent rally, the initial downside target would be the previously-broken red line based on the Aug and Sep lows, the Nov 22 high of $49.20 or even the 50-day moving average.
Before summarizing today's alert, we would also like to draw your attention to the relation between crude oil and silver.
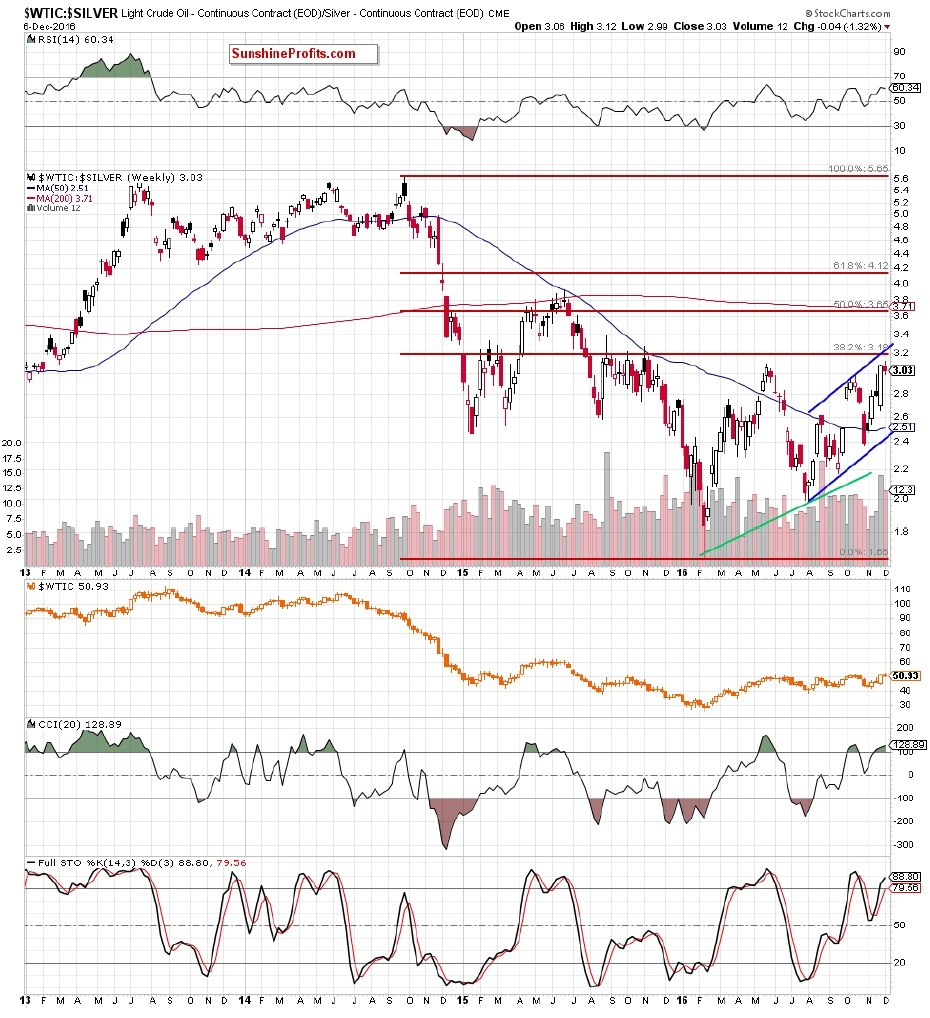
From the weekly perspective, we see that the last week's sharp increase approached the ratio not only to the upper line of the blue rising trend channel, but also to the 38.2% Fibonacci retracement which suggests that the space for further rally may be limited and reversal in the coming week(s) should not surprise us – especially when we take into account the very short-term picture.
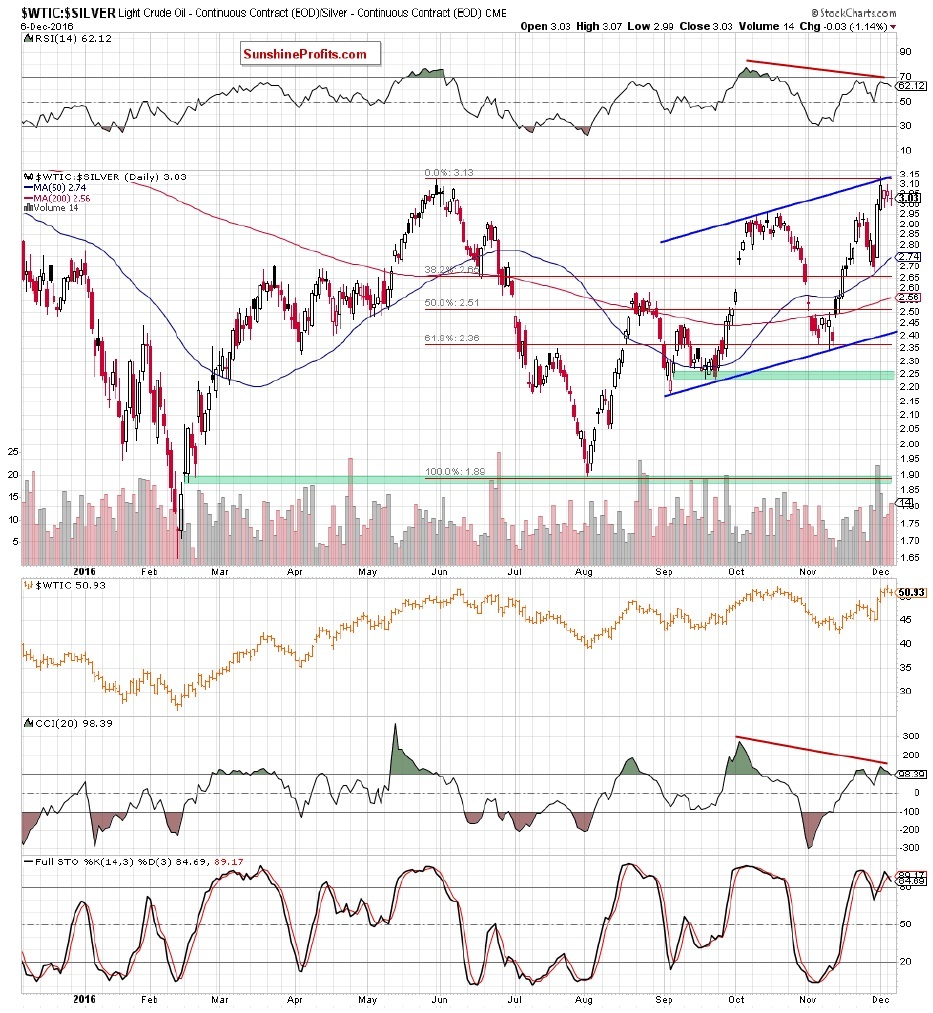
As you see from this perspective, although the ratio increased slightly above the May peak and the upper line of the blue rising trend channel, this improvement was very temporary and we noticed a pullback, which invalidated previous tiny breakouts (the first negative development). Additionally, the size of volume increased during recent sessions, which suggests that bulls may lose strength in near future. Another disturbing factor is negative divergence between all indicators and the ratio, which increases the likehood of reversal. If we see such price action, the price of crude oil should also move lower as (similarly to what we wrote in the case of oil-to-gold ratio) a positive correlation between the ratio and light crude is still in cards.
Naturally, what's bearish for the oil-to-metals ratios is bearish also for crude oil (it could have some short-term bullish implications for the precious metals market as well), which confirms our earlier observations regarding the black gold itself.
Summing up, the outlook for the crude oil appears to be bearish and its links with gold and silver appear to confirm it. It appears that the profits from our short position in crude oil will increase further before this trade is over.
Very short-term outlook: bearish
Short-term outlook: mixed with bearish bias
MT outlook: mixed
LT outlook: mixed
Trading position (short-term; our opinion): Short positions (with a stop-loss order at $54.51 and initial downside target at $45.43) are justified from the risk/reward perspective. We will keep you – our subscribers – informed should anything change.
Want free follow-ups to the above article and details not available to 99%+ investors? Sign up to our free newsletter today!
Author

Nadia Simmons
Sunshine Profits


