Crude oil is trading higher and the S&P 500 is lower [Video]
![Crude oil is trading higher and the S&P 500 is lower [Video]](https://editorial.fxstreet.com/images/Markets/Commodities/Energy/Oil/oil-platform-on-the-sea-38503532_XtraLarge.jpg)
US Dollar: Dec '20 USD Down at 92.125.
Energies: Jan'21 Crude is Up at 45.39.
Financials: The Dec '20 30 year bond is Up 7 ticks and trading at 173.04.
Indices: The Dec S&P 500 emini ES contract is 8 ticks Lower and trading at 3630.75.
Gold: The Dec'20 Gold contract is trading Up at 1809.20 Gold is 46 ticks Higher than its close.
Initial Conclusion
This is not a correlated market. The dollar is Down- and Crude is Up+ which is normal but the 30 year Bond is trading Higher. The Financials should always correlate with the US dollar such that if the dollar is lower then bonds should follow and vice-versa. The S&P is Lower and Crude is trading Higher which is correlated. Gold is trading Higher which is correlated with the US dollar trading Down- I tend to believe that Gold has an inverse relationship with the US Dollar as when the US Dollar is down, Gold tends to rise in value and vice-versa. Think of it as a seesaw, when one is up the other should be down. I point this out to you to make you aware that when we don't have a correlated market, it means something is wrong. As traders you need to be aware of this and proceed with your eyes wide open.
Asia traded Mixed with half the exchanges Higher and the other half Lower. All of Europe is trading Lower at this time.
Possible Challenges To Traders Today
-
Prelim GDP q/q is out at 8:30 AM EST. This is Major.
-
Unemployment Claims are out at 8:30 AM EST. This is Major.
-
Core Durable Goods Orders m/m is out at 8:30 AM EST. This is Major.
-
Durable Goods is out at 8:30 AM EST. This is Major.
-
Goods Trade Balance is out at 8:30 AM EST. Major.
-
Prelim GDP Price Index q/q is out at 8:30 AM EST. Major.
-
Prelim Wholesale Inventories is out at 8:30 AM EST. Major.
-
Revised UoM Consumer Sentiment is out at 10 AM, This is not Major.
-
Revised UoM Inflation Expectations is out at 10 AM. This is not Major.
-
Core PCE Price Index m/m is out at 10 AM EST. This is Major.
-
New Home Sales is out at 10 AM EST. This is Major.
-
Personal Income m/m is out at 10 AM EST. Major.
-
Personal Spending m/m is out at 10 AM EST. Major.
-
Crude Oil Inventories is out at 10:30 AM EST. This is Major.
-
Natural Gas Storage is out at 12 Noon EST. This is Major.
-
FOMC Meeting Minutes is out at 2 PM EST. This is Major.
Treasuries
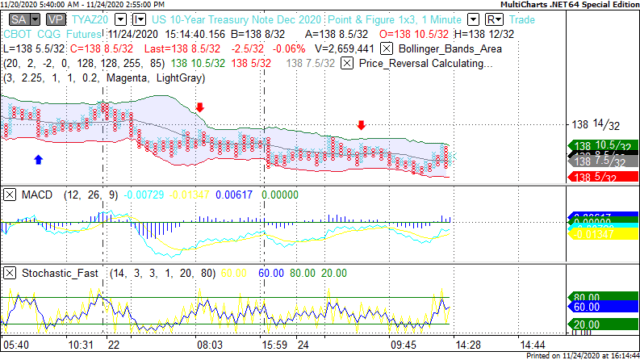
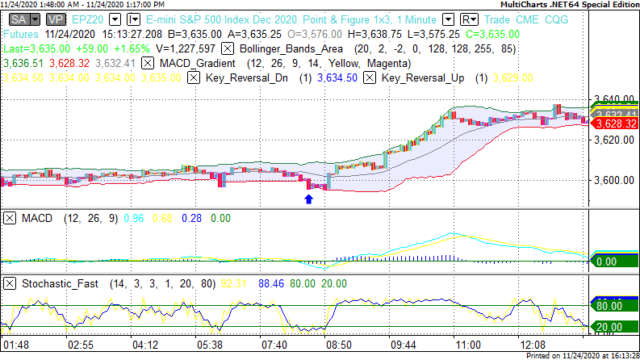
Traders please note that we've changed the Bond instrument from the 30 year (ZB) to the 10 year (ZN). They work exactly the same.
We've elected to switch gears a bit and show correlation between the 10 year bond (ZN) and The S&P futures contract. The S&P contract is the Standard and Poor's and the purpose is to show reverse correlation between the two instruments.Remember it's liken to a seesaw, when up goes up the other should go down and vice versa.
Yesterday the ZN made it's move at around 8:30 AM EST. The ZN hit a High at around that time and the S&P moved Higher. If you look at the charts below ZN gave a signal at around 8:30 AM EST and the S&P moved Higher at around the same time. Look at the charts below and you'll see a pattern for both assets. ZN hit a High at around 8:30 AM EST and the S&P was moving Higher shortly thereafter. These charts represent the newest version of MultiCharts and I've changed the timeframe to a 15 minute chart to display better. This represented a Shorting opportunity on the 10 year note, as a trader you could have netted about a dozen ticks per contract on this trade. Each tick is worth $15.625. Please note: the front month for the ZN is now Dec '20. The S&P contract is also Dec '20 as well. I've changed the format to Renko bars such that it may be more apparent and visible.
Charts Courtesy of MultiCharts built on an AMP platform
Bias
Yesterday we gave the markets an Upside bias as the USD and the Bonds were both trading Lower yesterday morning and this is usually indicative of an Upside day. The markets didn't disappoint as the Dow traded Higher by 455 points and the other indices closed Higher as well. Today we aren't dealing with a correlated market and our bias is Neutral.
Could this change? Of Course.Remember anything can happen in a volatile market.
Commentary
Yesterday the Dow hit and closed about the proverbial 30K mark for the first time ever. No doubt President Trump will claim credit for this as well but the reason why this happened had nothing to do with anything President Trump could conjure up. On Monday evening it was announced that the the transition to President elect Biden would begin as it is clear and obvious that Joe Biden won the election and apparently there are no further roadblocks. Trump tried to get the Republican controlled state legislatures in the battleground states to name Trump as the victor in those states but that idea backfired as the citizens of those states know who won already. Trump has demanded another recount in Georgia but that is all smoke and mirrors at this point. Today we have a tsunami of economic reports as tomorrow is Thanksgiving Day and the markets will be closed so those reports have been moved up to today. On a softer note, we wish all of you who read this a happy and joyous Thanksgiving Day. We are certain that even in these trying times you can find something to be thankful for. We will return on Monday, November 30. Happy Thanksgiving.
Author

Nick Mastrandrea
Market Tea Leaves


