Crude Oil Analysis - Crude Oil Completes an Elliott Wave Leg

On January 08th, 2020, our team highlighted the possibility of a new bearish leg in Crude Oil. During the first trading session of this week, the West Texas Intermediate (WTI) could be completing that bearish sequence.
Crude Oil falls $1.29 or 2.38% touching at $52.95 per barrel, while Brent Oil stumbles $1.58 or 2.59% falling until $59.22 per barrel.
In early January 2020, the big participants took advantage of the retail traders in the oil market with the increasingly bullish sentiment driven by rising tensions between the U.S. and Iran.
-637157388273573776.png)
On January 08th, 2020, the Crude Oil reached at $65.62, the highest level since late April 2019. Different news media covered the attack of a U.S. military base in Iraq and the potential increasing military tensions. However, both the U.S. Defense Secretary Mark Esper and Iran's Foreign Minister Mohammad Javad Zarif stated that they were not interested in to initiate a war.
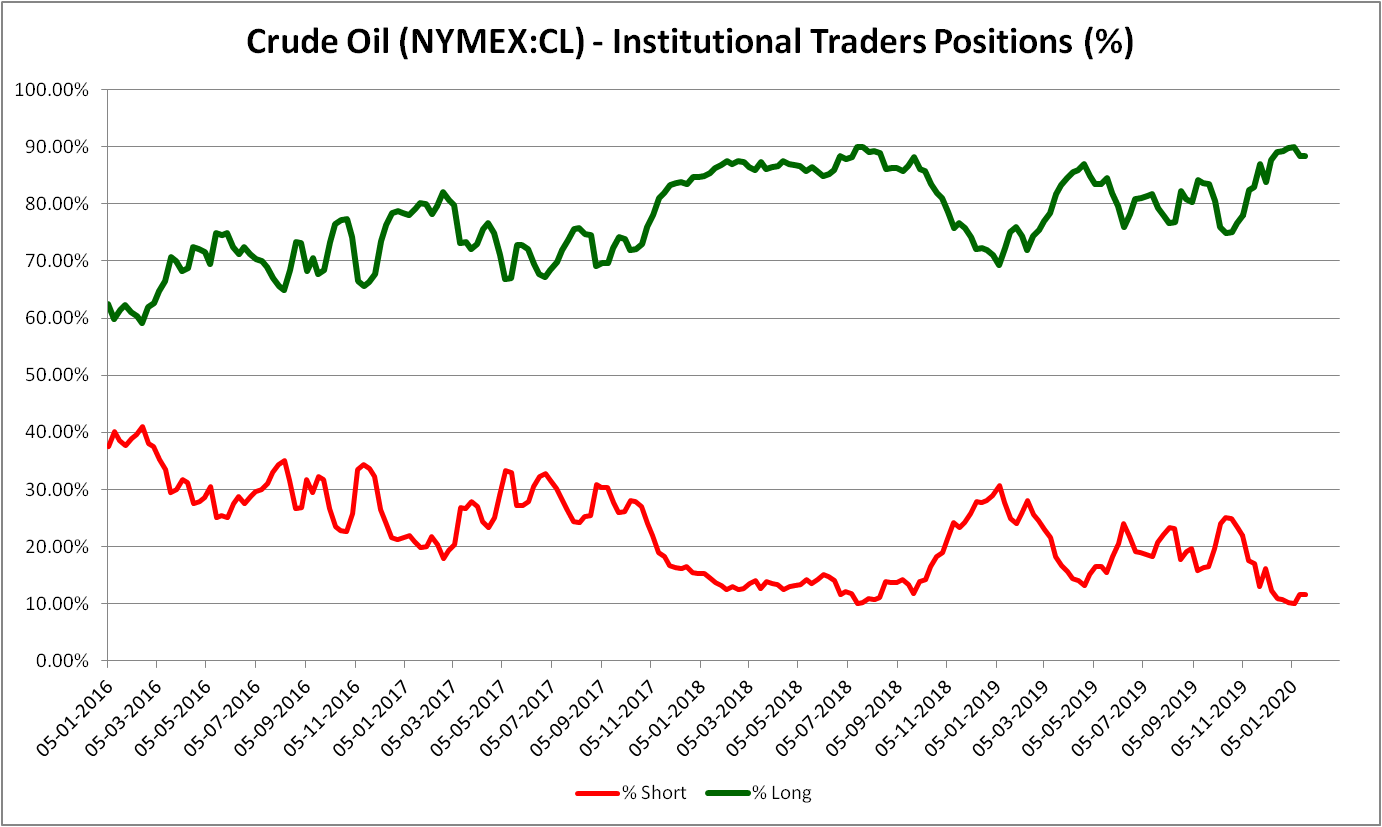
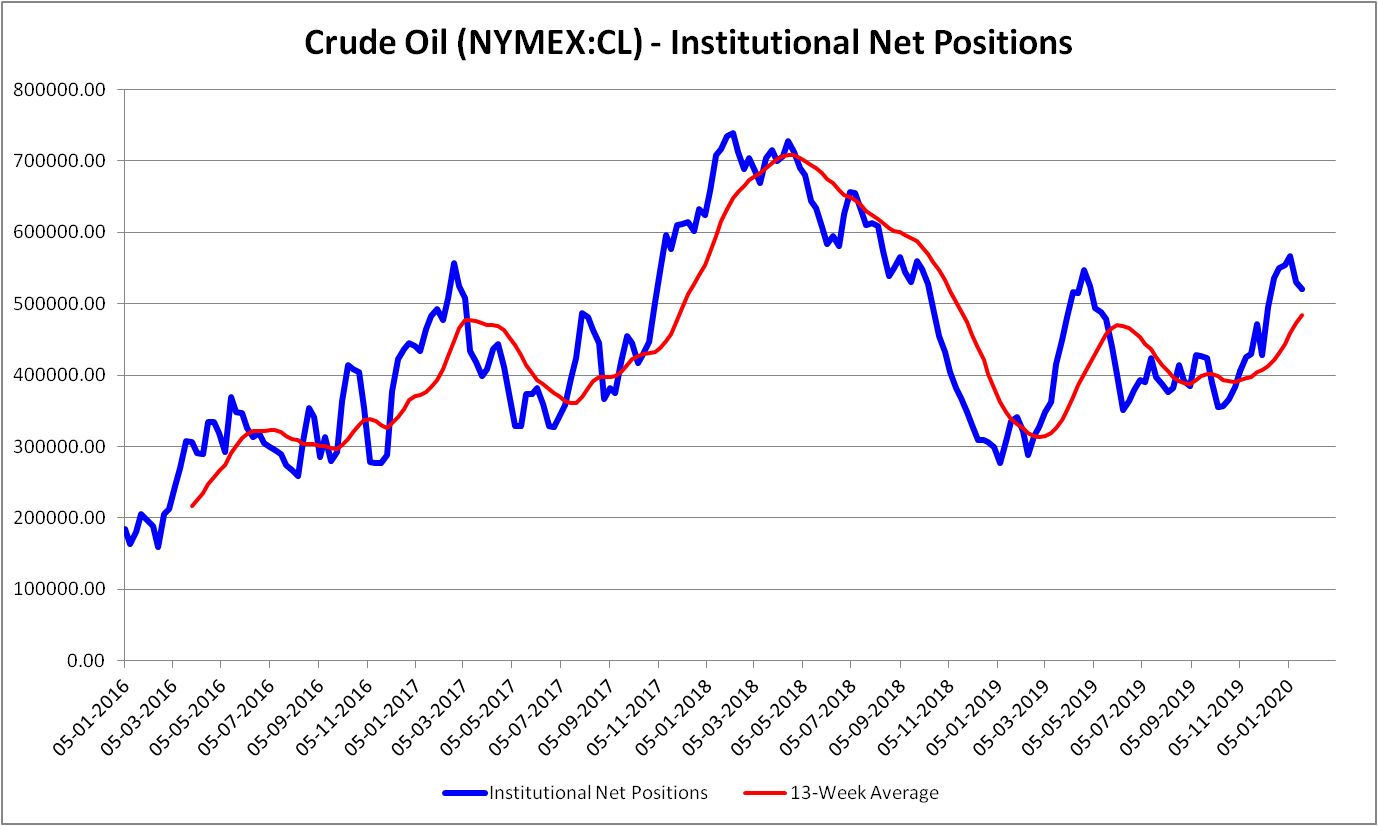
On the other hand, the institutional activity since early January 2020 to date, detailed in the CFTC report, showed a reduction in the long-side positioning.
In particular, in the report released on Friday 10th, speculative positions in the long-side reached an extreme high at 89.91%, but, in the last January 24th release, the long-side positioning declined till 88.40%.
In terms of the net positions, institutional traders reduced their net positioning from 567,272 contracts informed on January 10th to 520,568, stated last Friday 24th. Despite the reduction in long positions, the long-term bias continues being bullish.
The current institutional activity is the result of a taking profit activity, which could allow the big participants the re-incorporation for the long side.
Technical Overview
Currently, the Crude Oil price in its daily chart exposes the price action in a potential bottom in a long-term triangular structure in progress.
-637157389558434482.png)
If the long-term formation that the price action develops, Crude Oil should make a new upside in three waves.
According to the Elliott wave theory, a triangle pattern is subdivided into five internal segments that follow a 3-3-3-3-3 sequence.
A second scenario for the WTI is a potential upside developed in five waves. In this case, the price could surpass even the 2019's high at $66.58 per barrel.
In conclusion, despite the bearish sentiment driven by geopolitical conflicts or the fear boosted by the spread of coronavirus, Crude Oil futures traders keep its bullish bias. In consequence, in the near-term, big participants should drive the price to a new upward leg.
Author

EagleFX Team
EagleFX
EagleFX Team is an international group of market analysts with skills in fundamental and technical analysis, applying several methods to assess the state and likelihood of price movements on Forex, Commodities, Indices, Metals and


