CPI kills markets [Video]
![CPI kills markets [Video]](https://editorial.fxstreet.com/images/Macroeconomics/EconomicIndicator/Prices/CPI/tablet-with-consumer-price-index-cpi-business-concept-gm499730392-80399281_XtraLarge.jpg)
US Dollar: Jun '22 USD is Up at 104.580.
Energies: Jul '22 Crude is Down at 118.52
Financials: The Sep '22 30 Year bond is Down 24 ticks and trading at 134.26.
Indices: The Jun '22 S&P 500 emini ES contract is 356 ticks Lower and trading at 3813.00.
Gold: The Aug'22 Gold contract is trading Down at 1858.50. Gold is 170 ticks Lower than its close.
Initial conclusion
This is not a correlated market. The dollar is Up, and Crude is Down which is normal, but the 30-year Bond is trading Lower. The Financials should always correlate with the US dollar such that if the dollar is lower, then the bonds should follow and vice-versa. The S&P is Lower, and Crude is trading Lower which is not correlated. Gold is trading Lower which is correlated with the US dollar trading Up. I tend to believe that Gold has an inverse relationship with the US Dollar as when the US Dollar is down, Gold tends to rise in value and vice-versa. Think of it as a seesaw, when one is up the other should be down.I point this out to you to make you aware that when we don't have a correlated market, it means something is wrong. As traders you need to be aware of this and proceed with your eyes wide open. All of Asia is trading Lower with many exchanges trading in negative triple digit territory. Currently all of Europe is trading Lower as well.
Possible challenges to traders today
- FOMC Member Brainard Speaks at 2 PM EST. This is Major.
- No other Major news to speak of.
Treasuries
Traders, please note that we've changed the Bond instrument from the 30 year (ZB) to the 10 year (ZN). They work exactly the same.
We've elected to switch gears a bit and show correlation between the 10-year bond (ZN) and the S&P futures contract. The S&P contract is the Standard and Poor's, and the purpose is to show reverse correlation between the two instruments. Remember it's likened to a seesaw, when up goes up the other should go down and vice versa.
On Friday the ZN made its move at around 8:30 AM EST just as the CPI data was released. The ZN hit a Low at around that time and the S&P moved Lower shortly thereafter. If you look at the charts below ZN gave a signal at around 8:30 AM EST and the S&P moved Lower at around the same time. Look at the charts below and you'll see a pattern for both assets. ZN hit a Low at around 8:30 AM EST and the S&P was moving Lower shortly thereafter. These charts represent the newest version of MultiCharts and I've changed the timeframe to a 15-minute chart to display better. This represented a Long opportunity on the 10-year note, as a trader you could have netted about 20 ticks per contract on this trade. Each tick is worth $15.625. Please note: the front month for the ZN is now Jun '22. The S&P contract is also Jun' 22 as well. I've changed the format to Heikin-Ashi such that it may be more apparent and visible.
Charts courtesy of MultiCharts built on an AMP platform
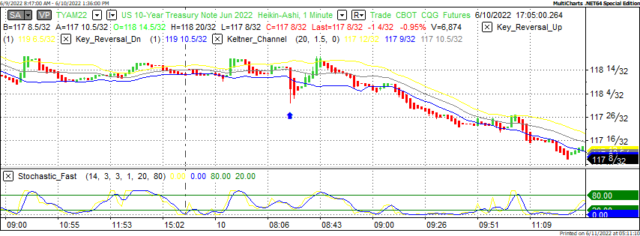
ZN - Jun 2022 - 06/10/22
-637907158743715860.png)
S&P - Jun 2022 - 06/10/22
Bias
On Friday we gave the markets a Neutral bias as we didn't see much in the way of correlation Friday morning. The markets veered to the Downside as the Dow closed 880 points Lower and the other indices traded Lower as well. Today we aren't dealing with a correlated market and our bias is to the Downside.
Could this change? Of Course. Remember anything can happen in a volatile market.
Commentary
On Friday the markets reacted violently to the CPI news that was released at 8:30 AM EST. It seems that inflation is at it's highest point in 40 years; coming in at over 8 percent. No one has seen this since 1981 and quite frankly having lived thru that time, things weren't that good. Inflation then hovered at around 13 percent, mortgage interest rates were double digit and unfortunately this was the era of Reaganomics and what followed wasn't pleasant. In order to combat inflation the Fed raised interest rates to a point where virtually nothing was buyable and in doing so sales and demand dropped off considerably and that triggered a severe recession where the US economy had an unemployment rate of over 9 percent. I just hope that the Fed doesn't do the same this time around as many people alive don't recall or remember that time. As a young fledgling executive at Revlon in Edison, NJ all union workers had to take a 20 percent pay cut as they were cut down to a 4 day work week and salaried personnel still had to work a 5 day work week as they couldn't cut our salaries but the layoffs were severe. I hope we don't return to those days.
Author

Nick Mastrandrea
Market Tea Leaves


