Correlations between specific markets are unnaturally high – Can this continue?

As traders or investors, we would like to believe that market prices fluctuate solely based on supply and demand logic. In other words, we want the markets to make mathematical sense according to the fundamental landscape. Yet, as we have been reminded, the math doesn’t always have to math. It isn’t only meme stocks or even AI stocks that can reprice for no other reason than the asset is going up, and market participants focused on FOMO are willing to jump on the bandwagon. In commodities, the rallies can also be exacerbated by the need for investors to hedge inflation risk. It isn’t possible to buy the CPI, but it is possible to buy the commodities believed to influence it. We’ve seen it in the wheat, oil, and natural gas markets after Russia invaded Ukraine. Each of these commodities eventually suffered the consequences of overzealous speculation.
Today, we see some of the same price chasing and inflation hedging in certain commodities, but the narrative is behind the curtains rather than out in the open. Because of this, it probably won’t see the same exuberance we saw in 2022. Further, those who bought into the inflation hedge narrative and were burned by ill-timed buys in leading commodity rallies will likely opt to sit this one out.
While there are certainly supportive narratives in each of the commodities that are on the upswing, we suspect some of the buying is being done systematically by funds or algos for the sole purpose of inflation hedges. One might even categorize this as part of the “Trump trade.” We have concluded this is due to unusually high correlation readings between certain commodities. For instance, over the last 30 trading days, WTI crude oil futures have settled in the same direction as natural gas 87% of the time, corn 88% of the time, live cattle 90% of the time, and gold and soybeans a more reasonable 75% and 79% of the time, respectively. One way to interpret this phenomenon is the buying is being driven by excess liquidity in the system looking for a home, rather than a rational fundamental premise.
We have noticed that the oil market has broken down in recent sessions, but cattle and corn have not; we believe oil is likely the leader, leaving the others vulnerable in the coming weeks.
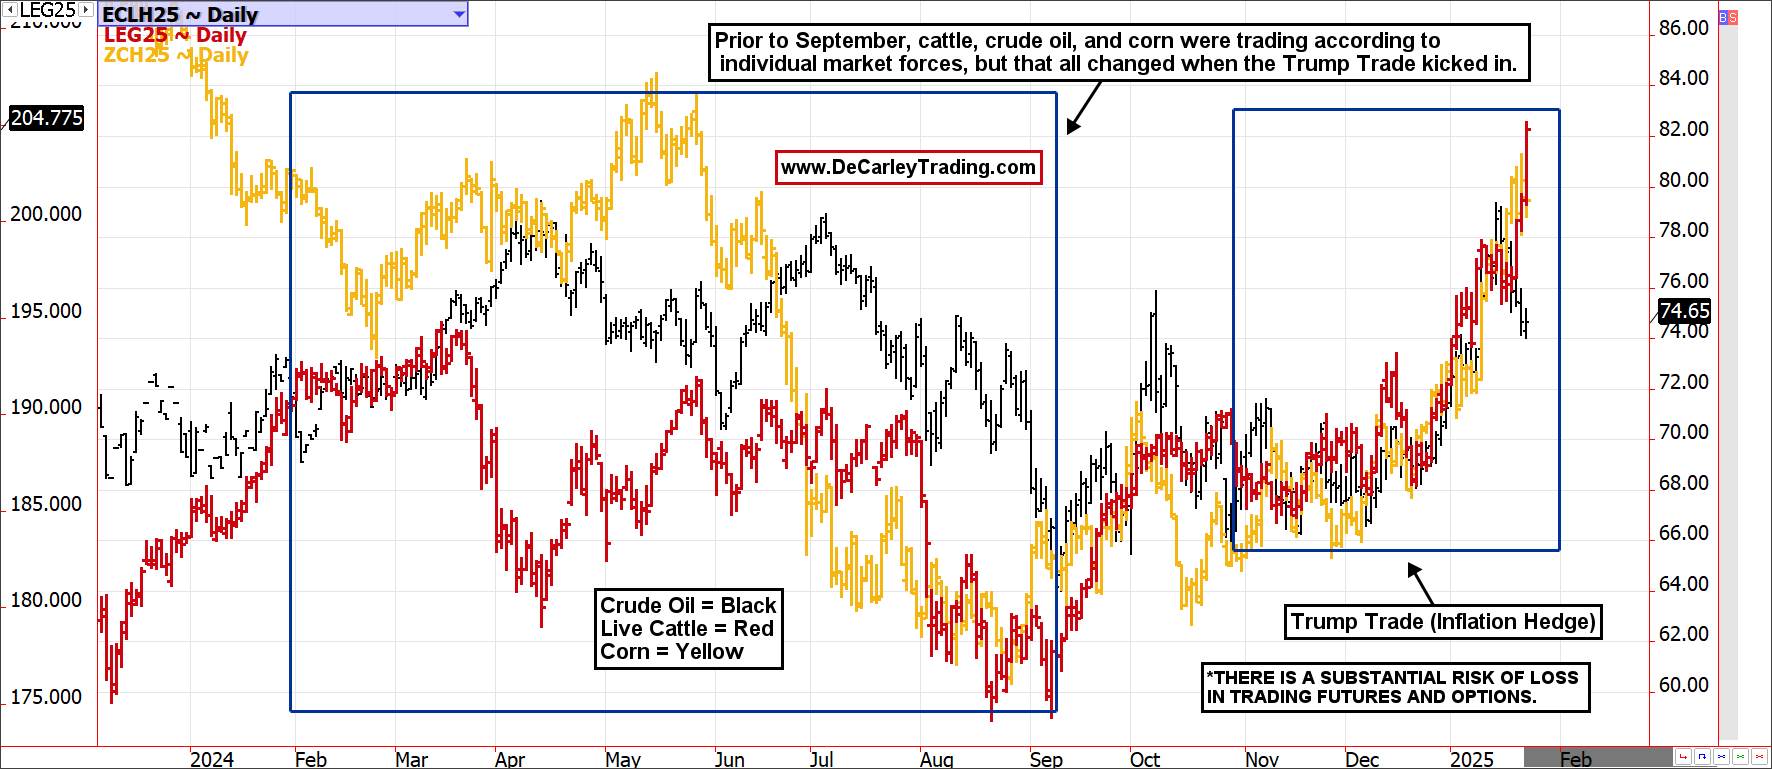
Almost as concerning is how the oil market trades with a strong positive correlation to the US dollar; the dollar and oil are running in the same direction about 75% of the time, while the British Pound and the euro are running a negative correlation with the greenback of over 90%! The oil and currency markets haven’t been conforming to historical norms for quite some time (since 2022, to be exact), but I don’t recall correlations ever being this absolute.
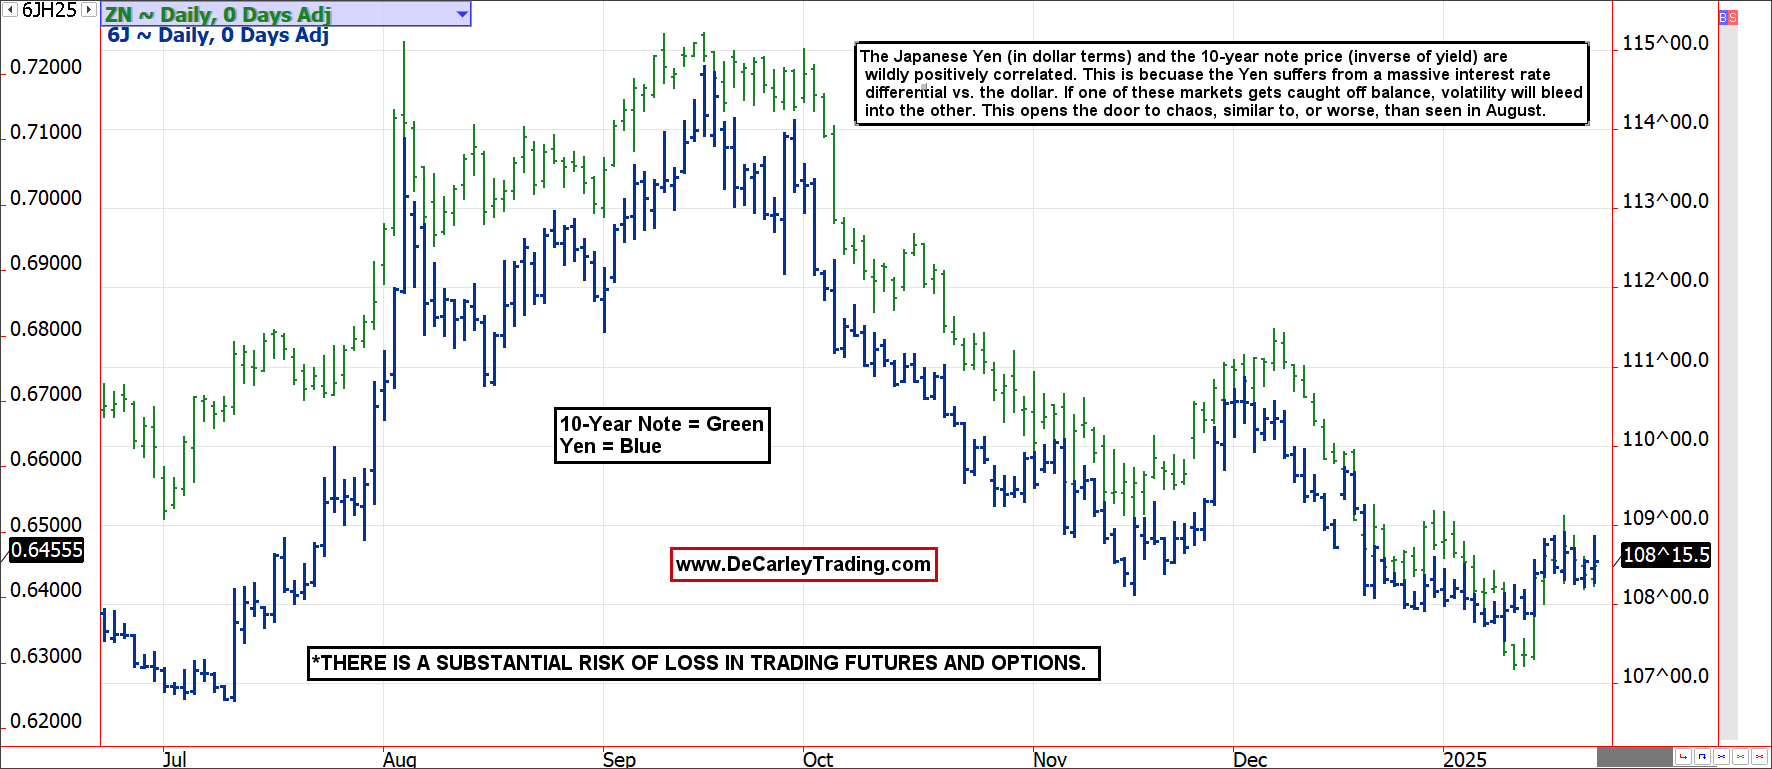
On the financial side of the tape, we see the Yen and the 10-year note settle in the same direction 93% of the time and opposite the US dollar index about 91% of the time. Such aggressive correlations are rare and generally unsustainable. Further, I believe they are a sign that many of the trends we’ve grown to accept in recent months could be in the last innings of the game. If something surprises or disrupts one asset, volatility will bleed into the other, and things can quickly become chaotic.
Conclusion
Unusually obsessive correlations suggest narratives rather than the underlying fundamentals are driving market trends. The “machines” can persist longer than we can stay solvent, but commodity prices are always temporary. There has never been a scenario in which a large commodity rally proves “this time is different” or “this is the new normal.” Although we would rather be bears than bulls in corn and crude oil, their current pricing isn’t historically obscene. On the other hand, cattle prices, bolstered by speculative and hedge inflation buying, are an accident waiting to happen. According to market positioning, current cattle futures pricing is akin to $8.00 corn or $17.00 beans; the market can continue higher in the short run, but the long-run prospects are dire.
Author

Carley Garner
DeCarley Trading
Carley Garner is an experienced commodity broker with DeCarley Trading, a division of Zaner, in Las Vegas, Nevada. She is also the author of multiple books including, “Higher Probability Commodity Trading” and “A Trader's First Book on Commodities”.
















