Corn selloff is coming as Wyckoff distribution is near completion [Video]
![Corn selloff is coming as Wyckoff distribution is near completion [Video]](https://editorial.fxstreet.com/images/Markets/Commodities/Agriculture/corn5-637443207812362641.jpg)
More weakness can be expected for Corn upon the confirmation of a reversal off the resistance from the Wyckoff distribution pattern.
Corn futures has been trending up strongly since January 2022. In April 2022, it was on a climatic run up (or better known as a parabolic run) as reflected in the price action and the increase of the volume.
After the buying climax (annotated as BC) formed on 18 April 2022, an automatic reaction (AR) was followed, which defined the boundary of the trading range between 780-815. Refer to the labelling of the events based on the Wyckoff method below.
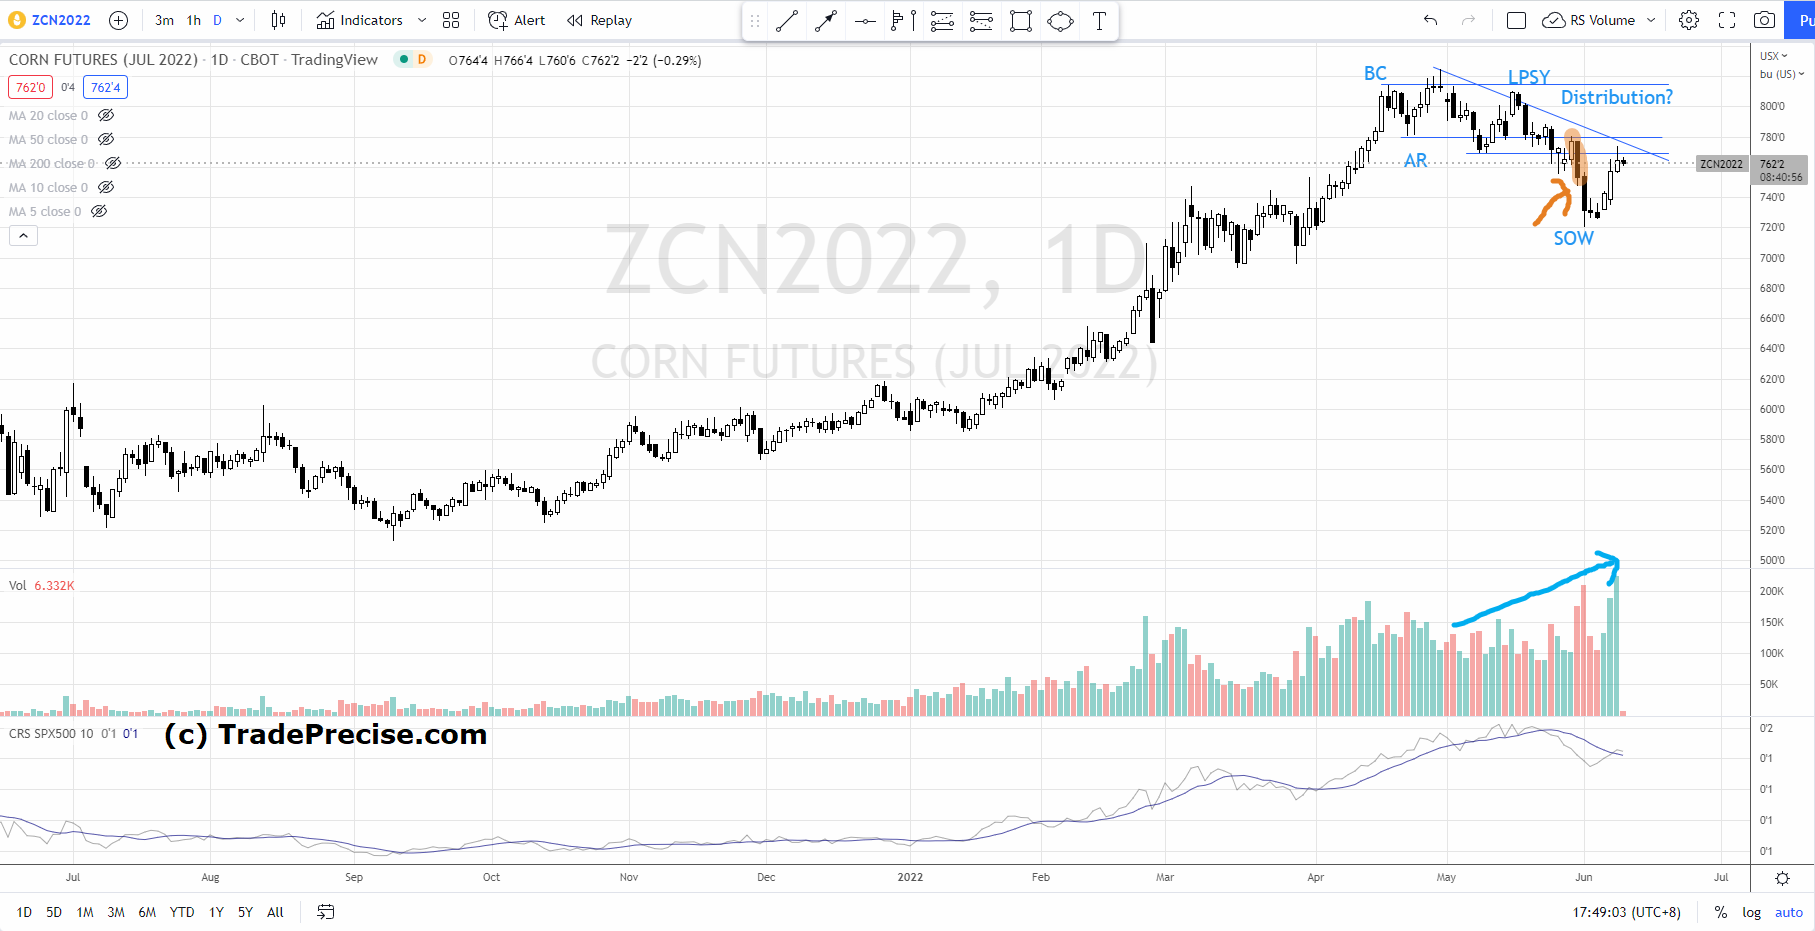
The reaction off the peak at 815 broke below the support at 780 followed by a lower high test as a last point of supply (LPSY), suggested supply was dominating. This was confirmed by the sign of weakness (SOW) that broke below the support area and tested 720.
The bearish momentum bars on 31 May with spike of volume becomes the supply zone where the current price action is still testing. On 8 Jun 2022 the bullish bar accompanied by the highest volume yet came with a rejection tail suggested presence of supply where the traders and investors sold into strength.
Should the Corn price commit below 755, it will form the reversal bar and will be the first confirmation of the Wyckoff distribution pattern. This should signal more weakness ahead in Corn price. The distribution price targets are 700 followed by 650.
The key concept for identifying a Wyckoff distribution structure lies on interpreting the price and volume, which is applicable to all instruments range from commodities to indices futures and stocks. Refer to the video below for the detailed analysis of the Wyckoff distribution in S&P 500 before a 10% crash happened.
Author

Ming Jong Tey
Independent Analyst
Ming Jong Tey has been trading since 2008. He started his learning journey from technical analysis (indicators, Fibonacci, etc...) to value investing. Throughout his journey, he develops an interest in price action with chart pattern trading.


