Copper hits an all-time COT extreme as metals positioning reaches a critical test [Video]
![Copper hits an all-time COT extreme as metals positioning reaches a critical test [Video]](https://editorial.fxsstatic.com/images/i/copper-02.jpg)
Commercials and Large Speculators in copper have reached their most extreme net positions in the available combined futures-and-options COT history. The conventional signal is bearish, but the 2003 copper rally shows why commercial capitulation remains a rare alternative, while the Swiss Franc and New Zealand Dollar also show notable bearish weekly positioning shifts.
Copper produced the clearest signal in this week’s Commitments of Traders report. In the combined futures-and-options data I use for this analysis, which extends back to 1995, both Commercials and Large Speculators are now at their most extreme net positions on record.
That is a genuinely unusual reading. The conventional interpretation is bearish, but copper’s own history shows why an all-time extreme should not be treated as an automatic reversal call.
Copper is more stretched than at any point in the available dataset
When I expand the copper chart to the maximum available history, the current positioning moves beyond every previous reading in both Commercial and Large Speculator net positions. The May 2024 episode offers a recent example of how this type of bearish stress can resolve: a large extreme developed around a market top and copper subsequently fell quickly.
That makes caution the more natural starting point. Commercials are hedgers connected to the physical market rather than simple directional speculators, while Large Speculators are large speculative participants. When both groups reach historically exceptional positions, it tells me that the market structure has become unusually stretched.
What it does not tell me is the exact day on which price must react. COT data is not a precise timing tool, and the most important question now is how copper behaves after reaching the extreme.
The 2003 rally keeps commercial capitulation on the table
Copper also provides an important counter-example. In 2003, the market reached what was then an all-time COT extreme, yet price continued higher instead of reversing.
I describe that type of move as commercial capitulation. Commercial participants may increase short hedges when prices become attractive from a business-risk perspective. If the market then continues rising far enough, those short hedges can come under increasing margin pressure. Forced reductions in those positions require buying back futures, which can add fuel to the rally instead of stopping it.
This is a rare outcome, and I would not treat it as the base case. But because copper has experienced it before, continued strength after today’s record positioning would be analytically important rather than something to dismiss as noise.
The broader metals complex is also flashing caution
Copper is not the only metal showing stress. At COTbase, I also monitor a metals complex that combines COT positioning from gold, silver, copper, platinum and palladium into a broader sector-level view.
Large Speculator positioning across that complex is again showing a bearish stress reading. Earlier this year, a similar bearish extreme developed around a period when the metals rally subsequently stalled. The present signal does not prove that the sector has reached a long-term top, but it does argue against assuming that recent strength can continue indefinitely without interruption.
The contrast is useful: copper itself is at an all-time contract-level extreme, while the broader metals complex is also warning that speculative positioning has become stretched.
Swiss Franc and New Zealand Dollar show bearish weekly change signals
For FX traders, the Swiss Franc and New Zealand Dollar produced the clearest weekly positioning changes.
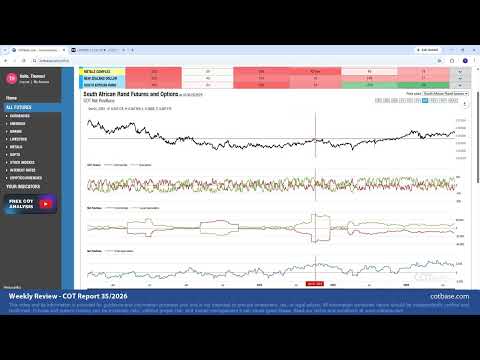
Commercial net positioning in Swiss Franc futures changed by 34%, a larger-than-average weekly move and a bearish COT change signal. There is no meaningful five-year positioning extreme, and the iCOT Scores are broadly neutral, so I would treat this primarily as a weekly change signal rather than a long-term stress signal. Because the futures contract is measured in US Dollars, the Dollar side of the relationship also needs to be analysed separately.
The New Zealand Dollar shows a similar distinction. Commercial net positions changed by 32%, the largest weekly change visible on the one-year horizon, and the change signal points towards weakness. The iCOT Scores, however, lean more towards the bullish side and do not confirm that bearish thesis, while five-year positioning remains relatively neutral.
That conflict matters. The latest weekly shift is significant, but it is not supported by a comparable long-term extreme.
Lean hogs and cotton show how differently extremes can resolve
Lean hogs offer the strongest bullish contrast this week. Both Commercials and Large Speculators are at an all-time COT extreme, and Thomas’s current interpretation is clearly bullish, pointing towards higher prices on a medium-term horizon rather than an immediate timing call.
Cotton, meanwhile, has reached a 254-report bearish extreme, roughly equivalent to five years of weekly reports. The conventional interpretation is for lower prices, although cotton also has historical examples of commercial capitulation, including 2010 and a bearish extreme in October 2021 that was followed by further gains.
Those exceptions are useful precisely because they prevent an extreme from becoming a mechanical trading rule. The signal identifies unusual pressure; price still determines how that pressure is released.
The reaction to copper’s extreme now matters more than the label
Copper is the market I would watch most closely from this report. The base case is that a bearish extreme of this magnitude should eventually constrain the rally or lead to a meaningful pullback. But the 2003 precedent means that a continued advance would raise a very different possibility: commercial capitulation.
The wider metals complex supports caution, while the Swiss Franc and New Zealand Dollar show bearish weekly positioning shifts without comparable long-term stress. Lean hogs remain bullish at an all-time extreme, and cotton is once again historically stretched on the bearish side.
I walk through the complete positioning picture and the underlying charts in this week’s full COT review:
This content was partially created by an AI tool.
Author

Thomas Lukacs
COTBase.com
Thomas Lukacs is the founder and CEO of COTbase.com.