Copper builds momentum into 2026 as industrial metals regain leadership

Industrial metals are entering the final stretch of 2025 with renewed strength, and copper is leading the move. After months of consolidation, the metal began a decisive rebound in September and has now extended its advance into late November. What initially looked like a technical correction has turned into the early phase of a potential structural shift for the entire commodity complex.
Markets are beginning to reassess the relative strength of sectors within commodities. Energy is dominated by oversupply concerns and uneven global demand. Agricultural markets remain sensitive to weather and geopolitical logistics. Precious metals benefit from monetary expectations. Industrial metals, however, are quietly emerging as the most compelling story for 2026.
Copper sits at the centre of that narrative. The Renko chart highlights a well defined upswing that began in September and has continued with consistent follow through. The combination of macro fundamentals, supply constraints and long term structural demand gives copper a profile that contrasts sharply with the directionless behaviour of other commodity segments.
A new phase for industrial Metals as Energy weakens
The past two years were dominated by energy prices and geopolitical disruptions. Oil, natural gas and refined products generated the largest headlines and shaped global inflation dynamics. That cycle is fading. Surplus conditions, moderated demand and stabilizing supply chains have reduced the influence of energy on global commodity indices.
This shift opens the door for a new form of leadership. Industrial metals are not reacting to short term noise. They are responding to fundamental pressures that have been building for years. The electrification of transport, the expansion of renewable energy, and the reinforcement of national grid infrastructure are all metal intensive processes. In contrast to energy, where cyclical behaviour dominates, industrial metals are supported by structural forces.
Copper, in particular, is the essential input for this transformation. It is required for electric vehicles, solar panels, wind turbines, high voltage cables, data centres and almost every component of modern infrastructure. That level of cross sector demand is rare and not easily substituted.
Supply struggles to keep pace with structural demand
The supply side of copper is constrained by geological, environmental and political limitations. Several major mines face grade depletion, declining ore quality and costly expansion requirements. New mining projects take years to reach production, and the global pipeline is thin relative to expected demand.
Recent production disruptions in South America, delays in African projects and the slow pace of investment combine to create conditions where the supply response remains insufficient. Major institutions, including UBS and independent commodity analysts, have highlighted the growing risk of structural deficits in 2026 and beyond.
These deficits do not manifest as dramatic shortages. Instead, they create a persistent upward bias in price during phases of stable macro conditions. When macro sentiment improves, copper reacts quickly and decisively.
Macro conditions align with copper’s advance
The macro environment is finally turning supportive. Expectations of Federal Reserve rate cuts in early or mid 2026 have eased real yields, weakened the dollar and improved sentiment toward materials that are sensitive to global growth and currency trends.
Copper historically performs well when the dollar softens and when financial conditions ease. The improvement of risk appetite also strengthens demand from speculative and institutional flows. In this context, the September rebound aligns with macro and micro factors that reinforce one another.
While global growth remains uneven, the forward looking components of manufacturing surveys in Europe, Asia and the United States show stabilization after a prolonged contraction phase. Industrial production is not booming, but it is no longer deteriorating. These early stabilization signals are enough to support copper when supply is tight and when long term structural demand remains intact.
The Renko structure confirms the September turnaround
The Renko chart captures the quality of copper’s rebound with remarkable clarity. After reaching a local low near the 4.50 dollars region, the metal formed a series of higher bricks beginning in September. This marked the turning point after a multi month period of sideways to downward drift.
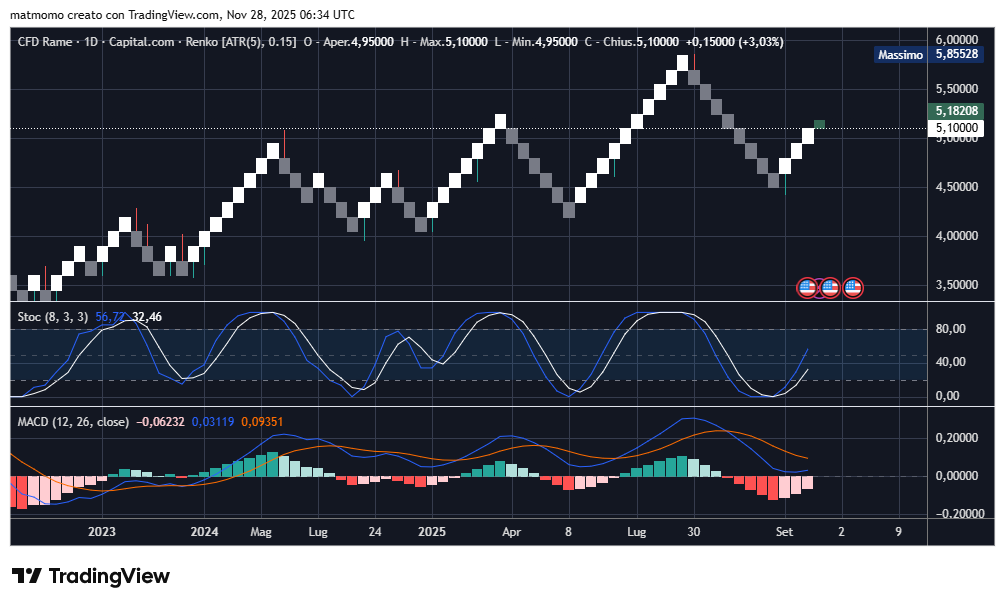
The structure that follows is consistent with a healthy early stage trend. Each corrective cluster prints shallower lows and each upward leg extends slightly farther. The most recent sequence shows copper approaching the 5.10 to 5.18 dollars area, with a firm recovery from the 4.95 to 5.00 dollars consolidation band.
The oscillator confirms the shift in momentum. Stochastic readings have turned upward from mid range levels after multiple rebounds that aligned with local pullbacks. The MACD histogram has shifted from deep negative territory to a gentle positive slope, reinforcing the idea that the September low was not accidental but cyclical.
The pattern resembles the early formation of a medium term uptrend rather than a tactical bounce. While the metal may face resistance near the 5.20 dollars zone, the underlying support structure is far stronger than what was observed during earlier phases of the year.
Key technical levels for copper heading into December
Copper’s price structure identifies several strategic levels that will guide near term behaviour.
The first level of support sits at the 5.00 dollars threshold. This is the psychological midpoint of the current leg and corresponds to the breakout zone from earlier in the autumn. Holding above it preserves the integrity of the upward sequence.
The second level lies around 4.95 dollars. This was the floor of the November consolidation and acted as a critical defensive area. Losing it would open the door to deeper retracement but not necessarily invalidate the broader trend.
On the upside, copper faces a local resistance zone near 5.18 dollars. This level represents the upper Renko brick alignment and a natural friction point. A breakout above 5.20 dollars would signal an extension of the bullish impulse and likely draw trend following flows into the market.
The long term threshold remains the 5.50 to 5.85 dollars range, visible on the right side of the chart. This zone represents a much larger structural target. Approaching it would require strong macro confirmation and sustained flows, but it remains an achievable objective if 2026 opens with favourable conditions.
Why 2026 could mark a metals led cycle
The possibility of a metals led commodity cycle has grown substantially in recent months. Several key trends support this outcome.
First, the global economy is transitioning into a phase where investment in infrastructure, electrification and climate adaptation accelerates. These processes require metals at every stage. Second, supply side challenges are unlikely to ease quickly. Mining constraints remain persistent and capital expenditure is still below what would be needed to rebalance the market. Third, the monetary environment favours assets that benefit from easing conditions and weaker currencies.
Industrial metals, and copper in particular, capture all these dimensions. They respond to cyclical improvements in global activity, benefit from structural demand and are supported by a macro regime that reduces financial pressure.
While energy markets remain weighed down by surplus risks and agricultural markets face unpredictable weather influences, industrial metals occupy a middle ground. They reflect both the health of the economic system and the long term technological trajectory.
Conclusion
Copper’s rebound from September marks more than a technical correction. It signals the early stages of a broader shift within the commodity complex. The transition from an energy dominated cycle to a metals driven cycle is beginning to appear in both price action and macro alignment.
The Renko chart confirms this transformation. Copper has built a clean structure of higher bricks, defended support zones and improving momentum. The macro backdrop enhances this technical picture, anchoring copper as one of the most strategically positioned commodities heading into 2026.
If global conditions remain stable and the supply constraints persist, copper may continue to assert its leadership. The coming months will determine whether this early phase becomes a full metals cycle. For now, the signs point to growing strength and a market that no longer behaves like it did in early 2025.
Author

Luca Mattei
LM Trading & Development
Luca Mattei is a market analyst focusing on FX, metals, and macroeconomic trends. He develops trading tools for retail and professional traders, coding indicators and EAs for MT4/MT5 and strategies in Pine Script for TradingView.


