Consumer Confidence Strongest Since December 2000: A Strong Contrarian Indicator?

Consumer Sentiment and Consumer Confidence are similar measures by two different organizations. The former is from the University of Michigan, the latter is by the Conference Board.
Consumer Confidence soared to 125.6 in March, up from 116.1 in February. This is the strongest reading in over 16 years.
Bloomberg Econoday cites the strength in both the current index and the expectations index, emphasis mine.
Highlights
It was two cycles ago that the consumer confidence index has been this high, at 125.6 in March for the strongest reading since December 2000. At 113.8, the expectations component hasn’t been this high since September 2000. The present situation component is at 143.1 for its best reading since August 2001 which was just at the end of the 1991 to 2001 economic cycle.
Subcomponents in the present situation are closely watched for indications on the monthly employment report and today’s results are very positive. Fewer, at 19.5 vs 19.9 percent, say jobs are hard to get this month and many more, at 31.7 vs February’s 26.9 percent, say jobs are plentiful.
A key reading on the expectations side is income, and here too the results are very positive. More this month, at 21.5 vs 19.2 percent, see their income increasing over the next six months and fewer, at only 7.0 vs 8.1 percent, see their income declining.
Buying plans are mixed with autos up but homes down. A negative in the report is a 2 tenths decline in 12-month inflation expectations to only 4.6 percent which is very low for this reading.
Consumers are extremely upbeat right now though the lack of inflation expectations doesn’t quite fit. What else doesn’t fit is actual consumer spending which has failed to match the strength underway in confidence. Watch on Friday for the consumer sentiment report which breaks down what it describes as unprecedented polarization in its sample between the optimism of Republicans and the pessimism of Democrats.
Questioning the Numbers
The conference board surveys 3,000 people every month.
Is 3,000 a sufficiently large number to map out confidence levels for the entire nation? I will ask Salil Mehta at Statistical Ideas for feedback on that question.
The more pertinent question, which I have discussed before, is: Does consumer confidence track spending?
That’s a widely held belief. And every month Econoday reinforces that belief with this statement: “While the level of consumer confidence is associated with consumer spending, the two do not move in tandem each and every month.”
Consumer Sentiment Snake Oil
On March 21, I wrote Consumer Sentiment Statistical Noise: Modern Day Snake Oil.
The charts I posted compared “consumer sentiment” by the University of Michigan, not “consumer confidence” by the conference board. The latter charges for its information. What follows is a set of charts from the preceding link.
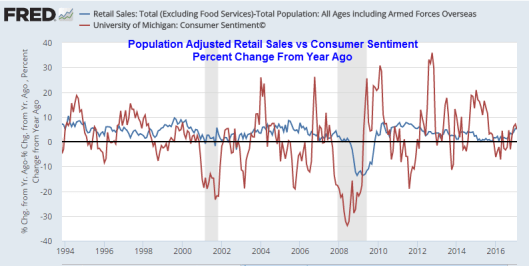
Consumer Sentiment vs. Retail Sales
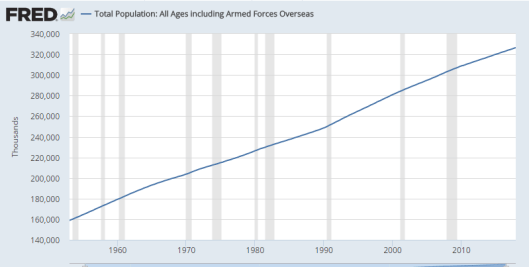
As you can see, retail sales keep marching higher and higher, slowing or stalling only in recessions. This is not an accurate comparison because the population is constantly growing.
I will adjust the chart in a moment, but first, let’s consider the population effect.
Total US Population
US Population Percent Change From Year Ago
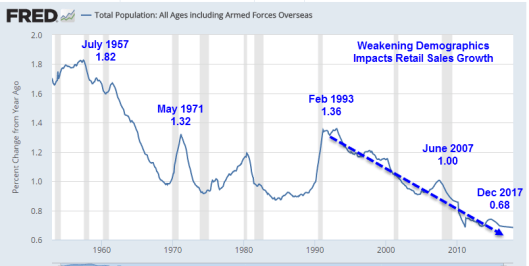
The impact of population growth is one of the factors that affect sales growth.
But age itself is a factor. The spending habits and needs of someone of age 3 are far different from someone age 13, 23, 43, 63, or 83.
Nonetheless, we can make a crude adjustment to retail sales by factoring in population changes.
Sentiment vs Retail Sales Percent Change Minus Population Percent Change
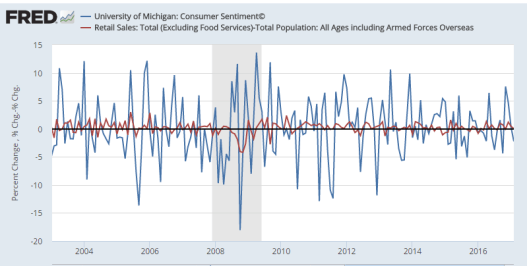
If that chart suggests anything, I sure don’t know what, other than volatility in sentiment is far bigger than volatility in retail sales.
Let’s adjust sentiment volatility by a factor of six to see if that helps.
Sentiment/6 vs Retail Sales Percent Change Minus Population Percent Change
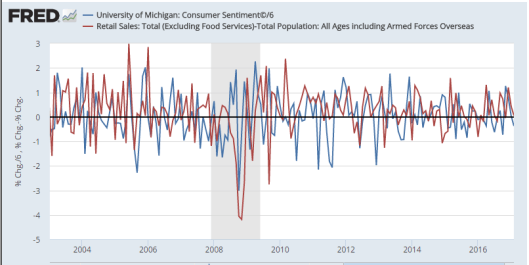
That chart looks like statistical noise. Sometimes the directions match sometimes they don’t. Perhaps month-to-month correlations are simply too frequent.
Population Adjusted Retail Sales vs Consumer Sentiment Percent Change From Year Ago
Let’s hone in on that for an amusing look.
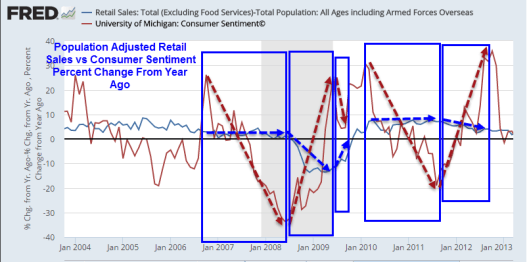
Population Adjusted Retail Sales vs Consumer Sentiment Percent Change From Year Ago – Detail
Modern Day Snake Oil
I was discussing economic indicators with Pater Tenebrarum at the Acting Man Blog a couple of days ago. He pinged me with the correct takeaway.
Economic forecasting is not a science, and it is actually not the task of economic science to make forecasts (contrary to what is commonly asserted). Forecasting is akin to the task of the historian. Mises called speculators “historians of the future”.
Economic laws only play a role insofar as they can be used as constraints for a forecast. The problem is that all these models simply look at the data of economic history, at statistical series that always turn tail “unexpectedly”, driven by human action.
All these mathematical models are complete humbug. It is modern-day snake oil.
Politics vs Sentiment
The above charts are sufficient to prove the snake oiliness of equating sentiment to spending as a predictor of anything.
The story gets even more amusing if you dive into further details of the University of Michigan survey.
The overall level of consumer sentiment remained quite favorable in early March due to renewed strength in current economic conditions as well as the extraordinary influence of partisanship on economic prospects. The Current Economic Conditions component reached its highest level since 2000, largely due to improved personal finances. While current economic conditions were not affected by partisanship, this was not true for the component about future economic prospects: among Democrats, the Expectations Index at 55.3 signaled that a deep recession was imminent, while among Republicans the Index at 122.4 indicated a new era of robust economic growth was ahead. Interestingly, those who self-identified as Independents had an Expectations Index of 88.3, which was nearly equal to the midpoint of the partisan difference. Importantly, there was no moderation in these extreme views from last month, with the maintenance of the partisan divide fueled by selective attention to economic news, with Democrats more frequently reporting unfavorable developments and Republicans more frequently hearing of favorable changes. Overall, the sentiment data has been characterized by rising optimism as well as by rising uncertainty due to the partisan divide. Optimism promotes discretionary spending, and uncertainty makes consumers more cautious spenders. This combination will result in uneven spending gains over time and across products.
Look Ahead Index of Sentiment
- Democrats: 55.3 Supposedly this signals “a deep recession is imminent.”
- Republicans: 122.4 Supposedly this indicates “a new era of robust economic growth is ahead“.
- Independents: 88.3 That is “nearly equal to the midpoint of the partisan difference.”
Consumer sentiment suggests a deep recession within a new era of economic growth in which nothing much at all happens. Economists believe consumer spending will follow.
What Does Sentiment Match?
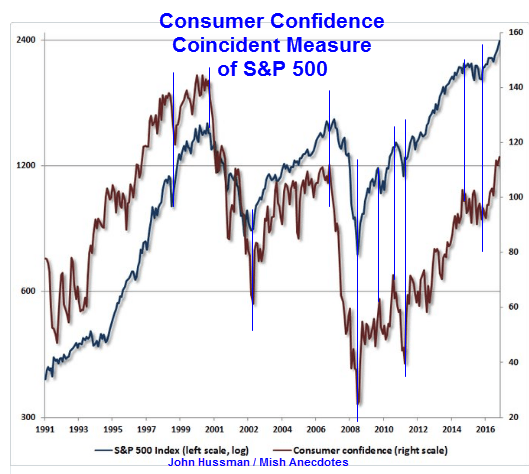
John Hussman provided the chart that got me diving into the above results. Once again, here it is:
Consumer Confidence vs. S&P 500
How Contrarian Is Such Confidence?
Belief in these measures of confidence and sentiment is high but the charts show such faith is seriously misplaced.
Moreover, please note that sentiment peaked just before the 2001 recession. It would be a fitting irony if the same happened again.
Why shouldn’t that be the case again?
Author

Mike “Mish” Shedlock's
Sitka Pacific Capital Management,Llc
Mike “Mish” Shedlock is a registered investment advisor for SitkaPacific Capital Management.


