Commodities Weekly: Oil near 3-month high on supply curbs

The weaker US dollar has benefited most commodities in the last week, though some agricultural commodities have failed to gain much traction.
Energy
CRUDE OIL prices have been rising steadily this year as planned production cuts by OPEC members and their allies restrict supply. Saudi Arabia limited production to 10.2 million barrels in January versus a target of 10.3 million, and announced plans to restrict production by a further 400,000 barrels in March.
Adding to the short squeeze, an unscheduled outage at Saudi Arabia’s largest offshore oilfield raised concerns about oil supply, while the US sanctions on Venezuela cut off those exports. Oil prices have risen for the past five days, helped along by a softer US dollar, and appear to be heading towards the 100-day moving average at $56.87. This average has capped prices since October 22. WTI is now at $55.75.
WTI Daily Chart
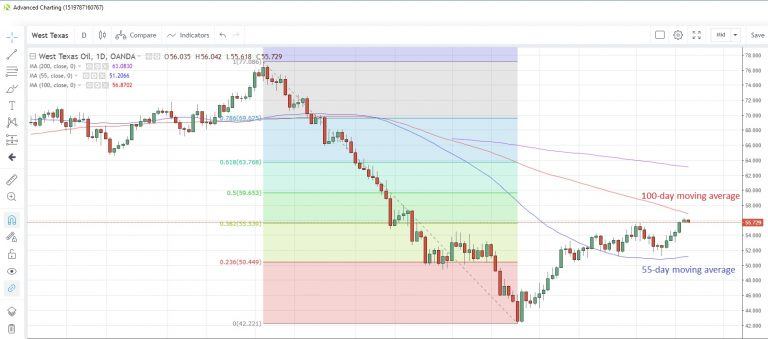
Source: OANDA fxTrade
The American Petroleum Institute is due to release its weekly crude oil stockpiles data as at February 15 later today. Last week saw the first drawdown of stockpiles in four weeks.
NATURAL GAS prices remain subdued despite severe frigid weather across the US Mid-west and Northeast prompting an increase in demand and drawdowns on gas storage over the past 13 weeks. The next storage data release from EIA on Thursday is expected to show a further drawdown of 157 billion cubic meters. Gas supply in the UK is also facing supply disruptions this week due to some unplanned outages.
Prices breached the 2018 lows last week, touching the lowest since December 22, 2017 last Friday. They are now at 2.652.
Precious metals
GOLD has benefited from a weaker US dollar during the past week, rising to a near-10 month high of 1,328 yesterday. Despite the latest uptick, speculative investors have been reducing longs for three straight weeks up to January 22, with net long positioning now at its lowest since the week of December 11, according to the latest delayed snapshot from CFTC.
Disasters at gold mines have featured heavily in the news recently, with a roof collapse at a mine in Liberia on February 10 and flooding in a mine in Zimbabwe on February 16, which resulted in the loss of 24 lives. The mines were relatively small contributors to global supply, so it is unlikely that these issues were responsible for gold’s recent rally.
Fun Fact: The durability gold was captured by a Bloomberg story last week which highlighted that at the Perth Mint in Australia, the same 14-pound gold bar has been melted down and recast more than 65,000 times since the mint opened its doors to visitors in 1993, while maintaining the same size and weight.
SILVER is also being supported by the US dollar’s decline, with the precious metal rallying from three-week lows struck last week. The gold/silver (Mint) ratio has been retreating from Fibonacci resistance at 84.347 since late last week. The Fibonacci level represents the 61.8% retracement of the drop from December 24 to January 4.
Gold/Silver Daily Chart
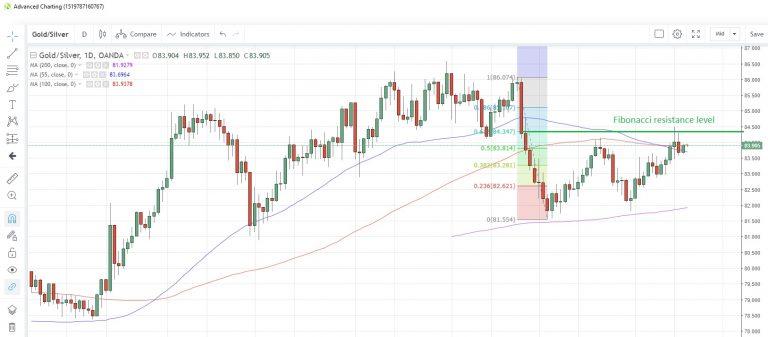
Source: OANDA fxTrade
PALLADIUM has touched a new record high this morning, given an additional boost from the weaker US dollar. The usual theme of high demand and short supply are still playing out in this market, with prices touching an intra-day high of 1,466 this morning. Additional upward pressure may also be coming from reductions in ETF holdings of the precious metal. Bloomberg has reported that they were just 712,000 troy ounces as at February 15, the lowest in almost a decade.
PLATINUM still remains the poor cousin to palladium, with prices languishing near the middle of a two-month range, as its demand for catalytic converters in diesel vehicles fails to equal those of petrol-driven ones. Speculative investors also appear to be unimpressed with the metal, with net long positions at their lowest since last September, according to the most recent data snapshot as at January 22 from CFTC.
Base metals
COPPER prices have rallied this week amid hopes for significant progress in the US-China trade talks which would help global growth and hence rekindle demand for the industrial metal. In addition, strong new loans data from China suggests economic stimulus measures may be filtering through in to the broader economy, which would again be supportive of copper. Talks last week in Beijing supposedly went “very well”, so much so that they will continue this week in Washington.
Speculative investors were net buyers for the first time in nine weeks, according to the January 22 snapshot from CFTC, suggesting there is more confidence in a bullish market returning.
India’s Supreme Court rejected a corporate application to restart a smelting facility in the country. This could have negative implications for copper supply going forward.
Agriculturals
WHEAT fell the most in eight weeks last week as news on the supply front was positive. Rains across India’s wheat producing regions this week are expected to be good for the March/April harvests, which pressured prices. Wheat did manage to hold above the 55-week moving average at 4.954, as it has done for more than a year.
Speculative positioning seems unfazed by the recent decline, with investors remaining net buyers for a third straight week, CFTC data as of January 22 shows. Net long positions are at their highest since the week of November 13.
SUGAR prices spiked higher last Friday amid supply-related news headlines. Brazil announced that some growers may delay the next harvest following a prolonged dry spell that has affected crops. In addition, India announced a 6.9% increase in the local minimum selling price, which stoked fears that millers may sell their produce locally rather than in global markets, thus crimping supply. Furthermore, Germany’s Suedzucker announced that it plans to shut two plants in France on top of the two recent closures in Germany, amid a “tough pricing environment”.
All this points to a possible disruption to supply, which should help to support prices going forward. Sugar closed at 0.13106 on Friday and markets were closed yesterday for the US holiday. They are expected to open higher today. The next potential resistance point could be the October high of 0.1333.
SOYBEANS have posted a series of higher monthly lows since the near-term base in September last year, as progress is reported in the US-China trade talks. It’s now at 9.049 with resistance appearing to be around the 9.216-9.206 area, which capped advances in December and February, respectively. Speculative positioning remains net short and at its highest since the week of November 27.
Bloomberg reported at the weekend that a number of soybean growers in Canada are switching to more lucrative crops, given that soybean prices first and hardest hit by the US-China trade spat. Soybean acreage is set to decline for a second consecutive year this year, to 6.12 million acres, according to Statistics Canada and Agriculture and Agri-food Canada.
Soybeans Daily Chart
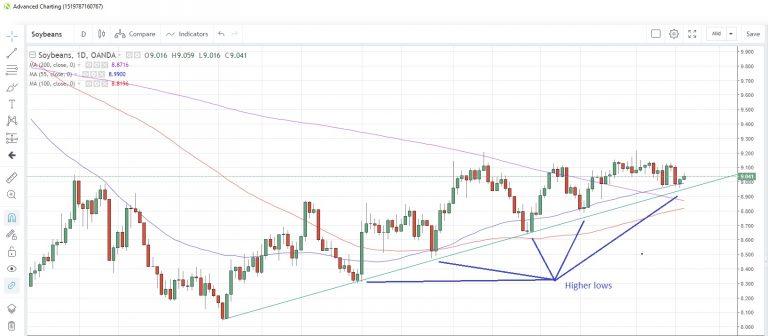
Source: OANDA fxTrade
CORN prices look set for the first up-day in three days today as the trade talks restart later this week. Prices appear to be struggling to overcome the 3.75 mark, with four consecutive daily attempts earlier this month beaten back, resulting in a close below the level. The 55-day moving average at 3.699 could possibly lend support in the near term. Corn is now at 3.727.
Author

Andrew Robinson
MarketPulse
A seasoned professional with more than 30 years’ experience in foreign exchange, interest rates and commodities, Andrew Robinson is a senior market analyst with OANDA, responsible for providing timely and relevant market commentar


