Commodities Weekly: Gold falls victim to dollar strength

A rebound in longer-dated US yields lifted the US dollar to 2019 highs which hurt the precious metal sector. Trade talk hopes and a resurfacing of geopolitical tensions lifted the energy sector while agricultural commodities await the annual US crop-counting tour.
Precious metals
GOLD has started this week negatively and could halt a three-week rising streak as it retreats from 6-1/2 year highs. A firmer US dollar and an improvement in risk appetite amid an apparent thawing of trade tensions have helped to undermine the precious metal.
However, as of last Friday, physical gold holdings by exchange-traded funds (ETFs) were the highest since March 2013, according to a Bloomberg report. Speculative investors turned net sellers of the commodity for the first time in five weeks in the week to August 13, pulling net long positions from the highest levels since September 2016, according to data from CFTC.
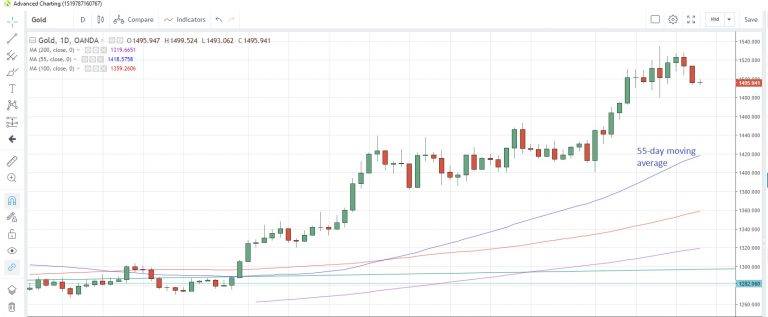
Source: OANDA fxTrade
SILVER has mirrored gold’s decline over the last two sessions amid broader US dollar strength. The metal could be headed for its first down-week in three, though the gold/silver (Mint) ratio has remained steady around the 100-day moving average at 88.45 for the past week.
Bloomberg reported Friday that silver holdings by ETFs were at record levels. Meanwhile, speculative investors scaled back net long position for a second consecutive week to August 13 and they are now at the lowest in five weeks, according to CFTC data.
PLATINUM reached the highest level in a week yesterday after the metal failed to breach the 200-day moving average support at 833.0 last week. Ahead of the rebound, speculative investors had been trimming net long positions in the week to August 13, and they are now at the lowest in three weeks.
PALLADIUM is testing resistance at the 55-day moving average at 1,490, which has remained untouched since the beginning of the month. Speculative investors are still net long of the metal, but those longs are at the lowest since the week of May 28, according to the latest data from CFTC.
Base metals
COPPER has found a bit of buoyancy this week amid perceptions of an apparent thawing of US-China trade tensions. US President Trump said the US is “doing very well with China”, though wasn’t ready to sign a deal just yet, while his Administration granted a 90-day reprieve to Huawei yesterday, which would allow it to conduct some business with US clients.
Copper stocks at warehouses monitored by the London Metal Exchange were at their highest since April 2018 as at last Friday, suggesting the demand side of the equation is not quite picking up yet. Speculative investors were net buyers of the industrial metal for the first time in three weeks to August 13, which pulled net short positions from extreme levels, the latest data from CFTC show.
Energy
CRUDE OIL prices were given a lift at the start of this week as geopolitical tensions came back in to focus following an attack on a Saudi oilfield at the weekend. Saudi Arabia declared that there was no disruption to supply as the attack only resulted in a small fire. US drillers added to the number of oil rigs in production last week for the first time since June, according to the weekly Baker Hughes data.
An apparent thawing in US-China trade tensions also helped upward momentum and West Texas Intermediate (WTI) opened above the 200-day moving average at $56.06 this morning for the first time in six days. Furthermore, the 55-day moving average at $55.91 looks poised to cross above the 200-day moving average later this week, which is often interpreted as a medium-term bullish technical signal.
Speculative investors turned net buyers of crude oil for the first time in four weeks in the week to August 13, according to the latest data snapshot from CFTC.
West Texas Intermediate Daily Chart

Source: OANDA fxTrade
NATURAL GAS prices have been trading in a narrow range over the past week and are still struggling to overcome resistance at the 55-day moving average of 2.274, which has capped prices on a closing basis since July 12. Waning temperatures across most of the US Midwest for the August 26 to September 1 period are causing demand forecasts to be revised lower.
Natural gas did manage to post its first positive week in more than a month last week, but slumped as much as 3.2% yesterday before closing just 0.2% lower. Speculative investors remain bearish on the commodity after increasing net short positions for a fourth consecutive week in the week to August 13, boosting them to the highest level since December 2015, according to the latest CFTC data.
Agriculturals
WHEAT prices touched the lowest level since May 24 yesterday, extending the decline which started on August 12 following the US Department of Agriculture’s World Agricultural Supply and Demand (WASDE) report. The gloomy oversupply outlook contained in the report pushed wheat prices to the biggest weekly loss since February last week, with the 200-week moving average at 4.558, which has supported prices since May, the next possible support point. The outlook will either be confirmed or denied by the annual crop-counting tour across seven Midwestern states, which gets underway this week.
Speculative accounts trimmed their net long positions to the lowest in nine weeks in the week to August 13, the latest CFTC data show.
Wheat Daily Chart
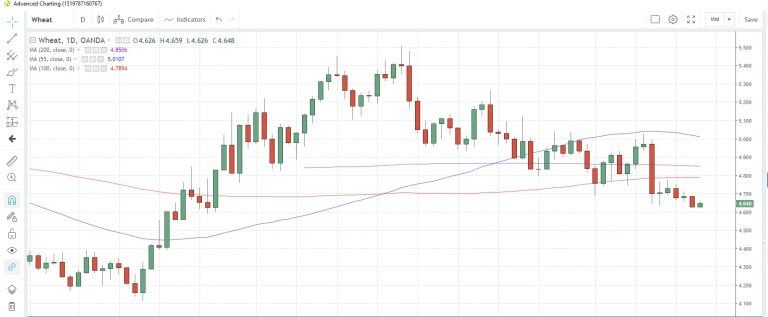
Source: OANDA fxTrade
CORN slumped to the lowest level since mid-May last week following the WASDE report, and is trading in the red so far this week. Speculative investors were net sellers of the commodity for a fourth straight week to August 13, reducing net long positions to the least since the week of May 28, according to CFTC data.
SOYBEANS remain confined to a relatively tight 8.40-8.80 range so far this month, having failed to overcome the 200-day moving average last week. That moving average is now at 8.78 and has capped prices on a closing basis since July 30. Speculative accounts turned net buyers for the first time in four weeks to August 13, the latest data from CFTC show.
SUGAR prices fell the most in a week yesterday to touch the lowest level in 12 days. The industry is constantly battling oversupply conditions and a shift toward more healthy lifestyles. Sugar closed at 0.11338 yesterday, the lowest close since August 8.
Author

Andrew Robinson
MarketPulse
A seasoned professional with more than 30 years’ experience in foreign exchange, interest rates and commodities, Andrew Robinson is a senior market analyst with OANDA, responsible for providing timely and relevant market commentar