Coffee Elliott Wave technical analysis [Video]
![Coffee Elliott Wave technical analysis [Video]](https://editorial.fxstreet.com/images/Markets/Commodities/Agriculture/Coffee/coffee-beans-background-46166242.jpg)
Coffee Elliott Wave analysis
Coffee prices are beginning to turn lower after completing a key technical chart pattern. The commodity has been on a strong upward trajectory since October 2023, but a corrective decline now seems likely before the next leg of the rally resumes, continuing the bullish sequence from late 2023. This analysis explores the potential for a pullback and identifies key levels where the next move higher could emerge.
Long-term chart analysis
Coffee prices have historically traded within a wide range, with support levels between $40 and $55, and resistance levels ranging from $276 to $337. The current bullish cycle for coffee started back in May 2019, marking the beginning of a significant upward move. The first phase of this cycle peaked in February 2022, when coffee prices reached notable highs. A corrective second phase followed, ending with a bottom in January 2023. After this low, the third and ongoing phase of the bullish cycle began, and it is evolving as part of a larger corrective pattern within the broader Elliott Wave structure.
The third phase of the rally appears to be developing as a corrective wave, which is part of the larger impulse that started in 2019. With this in mind, the current price action suggests that further gains may come, but not before a significant pullback takes place.
Daily chart analysis
On the daily chart, the third phase of the recovery completed its first leg, labeled wave (W), in April 2023. This was followed by a three-wave corrective structure, wave (X), which ended at 143.70 in October 2023, confirming support at that level. The subsequent rally represents wave (Y) of the primary degree wave W (circled), completing the bullish phase.
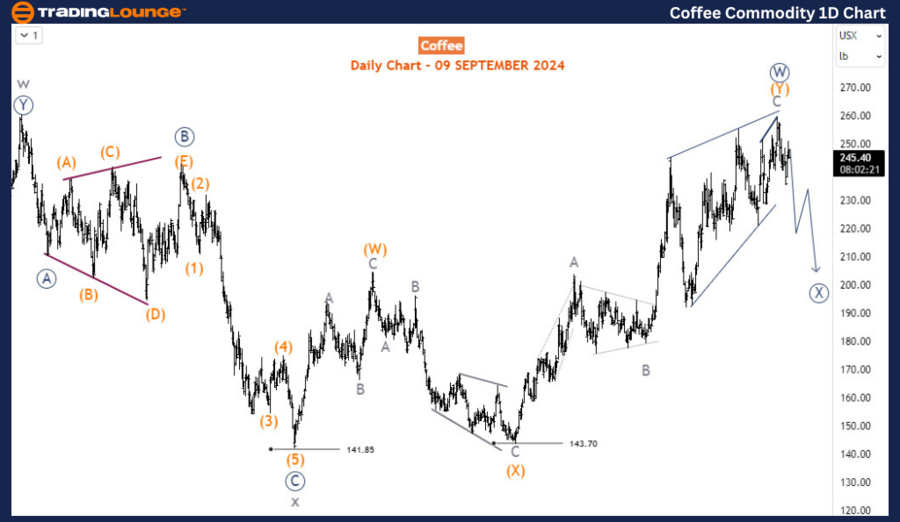
Wave (Y) of W (circled) appears to have formed an ending diagonal structure, signaling the exhaustion of the uptrend. With this structure potentially completed, a corrective pullback in wave X (circled) is expected. Given the sub-wave structure, this correction could take the form of a double zigzag, a complex corrective pattern that typically leads to further downside before the uptrend resumes.
Four-hour chart analysis
On the H4 chart, wave (Y) of W (circled) has completed a diagonal pattern, indicating that the rally is running out of steam. The immediate decline that has followed can be identified as wave W of (W) of Y (circled), the first phase of the larger corrective structure. A bounce in wave X is anticipated, but it is expected to remain below the August 2024 high. Once this bounce is complete, another leg lower in wave Y of (W) is likely, completing the initial correction phase.
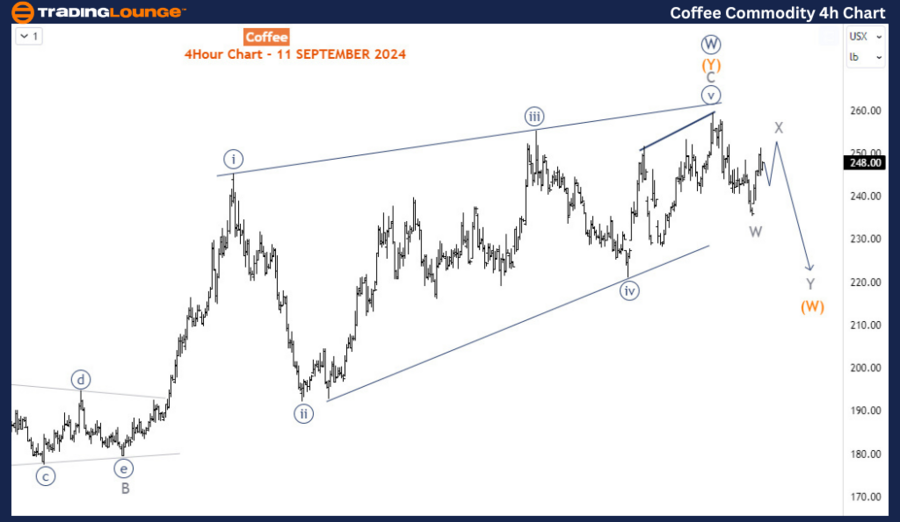
Thus, while the long-term trend remains bullish for coffee, the market appears to be in the midst of a bearish retracement that could extend lower over the coming weeks. This corrective phase will likely persist as long as the August 2024 high is not breached, offering traders an opportunity to reassess before the next major rally unfolds.
Coffee Elliott Wave technical analysis [Video]
Author

Peter Mathers
TradingLounge
Peter Mathers started actively trading in 1982. He began his career at Hoei and Shoin, a Japanese futures trading company.


