China Syndrome Strikes Again and Again
US Dollar: Dec USD is Down at 98.660.
Energies: Nov '19 Crude is Down at 52.61.
Financials: The Dec 30 year bond is Down 2 ticks and trading at 164.16.
Indices: The Dec S&P 500 emini ES contract is 58 ticks Higher and trading at 2907.00.
Gold: The Dec Gold contract is trading Up at 1510.90. Gold is 70 ticks Higher than its close.
Initial Conclusion
This is not a correlated market. The dollar is Down- and Crude is Down- which is not normal and the 30 year Bond is trading Lower. The Financials should always correlate with the US dollar such that if the dollar is lower then bonds should follow and vice-versa. The S&P is Higher and Crude is trading Lower which is correlated. Gold is trading Higher which is correlated with the US dollar trading Down. I tend to believe that Gold has an inverse relationship with the US Dollar as when the US Dollar is down, Gold tends to rise in value and vice-versa. Think of it as a seesaw, when one is up the other should be down. I point this out to you to make you aware that when we don't have a correlated market, it means something is wrong. As traders you need to be aware of this and proceed with your eyes wide open.
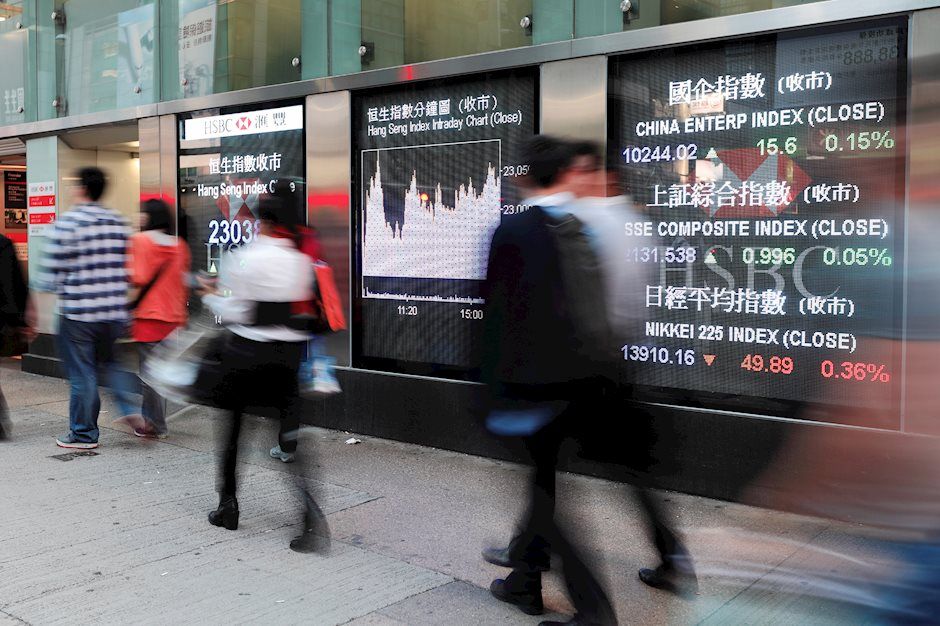
At this time Asia is trading Lower with the exception of the Indian Sensex and Shanghai exchanges which are Higher. Currently all of Europe is trading Higher at this time.
Possible Challenges To Traders Today
-
Final Wholesale Inventories is out at 10 AM EST. This is major.
-
JOLTS Job Openings is out at 10 AM EST. This is major.
-
Crude Oil Inventories is out at 10:30 AM EST. This is major.
-
Fed Chair Powell Speaks at 11 AM EST. This is major.
-
FOMC Member George Speaks at 11 AM. This is major.
-
10-y Bond Auction starts at 1 PM. This is major.
-
FOMC Meeting Minutes is out at 2 PM EST. This is major.
Treasuries
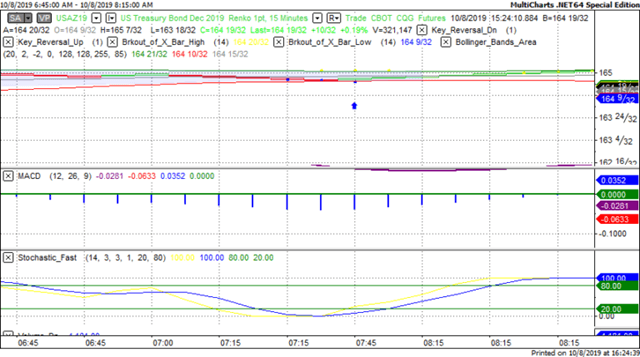
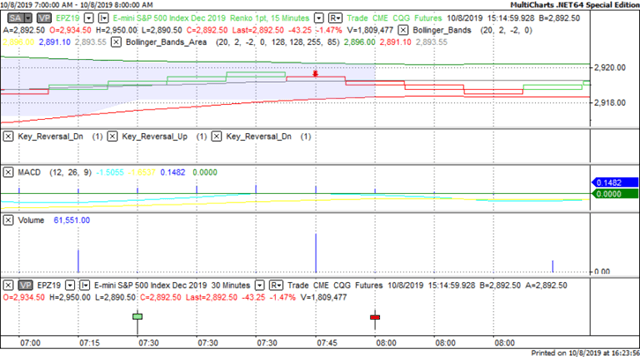
We've elected to switch gears a bit and show correlation between the 30 year bond (ZB) and The S&P futures contract. The S&P contract is the Standard and Poor's and the purpose is to show reverse correlation between the two instruments. Remember it's liken to a seesaw, when up goes up the other should go down and vice versa.
Yesterday the ZB made a major move at around 8 AM EST. The ZB hit a Low at around that time and the S&P hit a High. If you look at the charts below ZB gave a signal at around 8 AM EST and the S&P was moving Lower at the same time. Look at the charts below and you'll see a pattern for both assets. ZB hit a Low at around 8 AM and the S&P was moving Lower at the same time. These charts represent the newest version of MultiCharts and I've changed the timeframe to a 15 minute chart to display better. This represented a Long opportunity on the 30 year bond, as a trader you could have netted about a dozen ticks per contract on this trade. Each tick is worth $31.25. Please note: the front month for the ZB is now December. The S&P contract is now at December as well and I've changed the format to Renko bars such that it may be more apparent and visible.
Charts Courtesy of MultiCharts built on an AMP platform.
Bias
Yesterday we gave the markets a Neutral bias as we didn't see any signs of correlation whatsoever. The Dow dropped 314 points and the other indices lost ground as well. Today we aren't dealing with a correlated market and our bias is to the Upside.
Could this change? Of Course. Remember anything can happen in a volatile market.
Commentary
So here we are at Day Two of the China Syndrome. So what happened? It seems as though hope is fading of any kind of trade agreement between the US and China. Late Monday the US blacklisted 28 Chinese companies for their role in human rights violations, something the Chinese have said would be off the table come Thursday for the proposed meeting between the two super powers. As such and because of this the Dow dropped over 300 points and the other indices suffered as well. The bright was Fed Chair Powell's speech which hinted at proposed rate cuts.
Author

Nick Mastrandrea
Market Tea Leaves


