BP Cycles and Elliott Wave from February 2016

Firstly I would like to mention the data I have on the BP stock goes back to around 1968 when prices were ranging around in between 1 & 2 dollars. The stock price rose until the November 2007 highs. There it ended a cycle up from the all time lows. From there a sharp pull back lower in price was seen until the June 2010 lows. The point of this is to point out technically why the stock may see some pain before resuming an uptrend.
Secondly from there the bounce into the January 2011 high effectively ended a pullback cycle. That corrected the move up from the all time lows. From that January 2011 high price appears to have been an Elliott Wave flat structure that subdivides as 3-3-5. This remained above the June 2010 lows and ended on February 11, 2016. That is where the analysis starts on the daily chart shown below.
The analysis continues below the daily chart.
BP Daily Chart
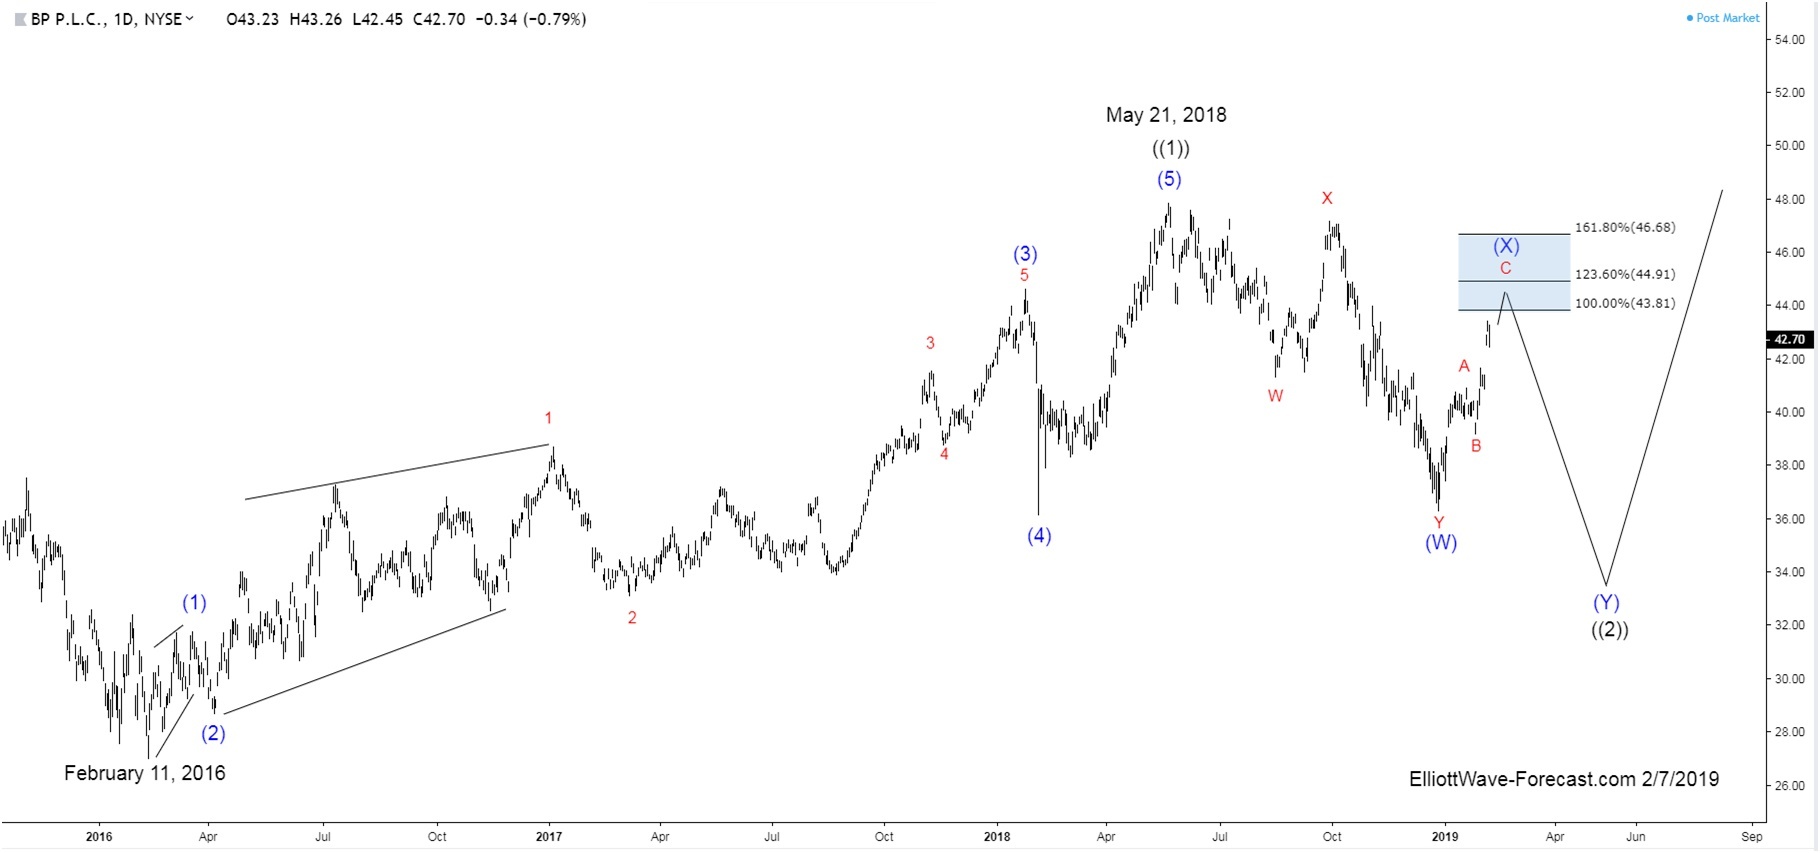
Thirdly I will remind the 2016 lows did remain above the 2010 lows. That in itself will create a degree of bullishness as far as technically speaking. The bounce from the February 2016 lows is not the prettiest wave structure I ever saw however it appears to be an impulse. This cycle ended on May 21, 2018. The pullback lower from there in the blue (W) is actually enough to be a complete three swing correction against the uptrend from 2016. I do however have other correlated reasons why it can still see another swing lower before resuming higher.
In conclusion. The correlated market in Crude Oil appears it can see some further weakness to correct the cycle up from the 2016 lows. A strong possibility exists for a broader indices market selloff again as well. This Fibonacci extension area highlighted on the chart may still be seen before a pullback lower again. From that area, at a minimum it should at least correct the cycle up from the December 26, 2018 lows before a sustained move higher again.
Become a Successful Trader and Master Elliott Wave like a Pro. Start your Free 14 Day Trial at - Elliott Wave Forecast.
Author

Elliott Wave Forecast Team
ElliottWave-Forecast.com


