Bonds poised to rally in late April

March Review – T-Bonds had a huge rally to all-time new highs into the end of February, as the virus panicked money looked for a safe haven. We have a major aspect for T-Bonds for the 2/28 weekend. There is a good chance for, at a minimum, a short term high by Monday, 3/2. Key Dates – 3/2, 3/9-10, 3/11, 3/16, 3/17, 3/18, 3/19, 3/23, 3/24, 3/27”
Results – 3/2 was not effective. 3/9 was the exact high of the month and all-time high. However, that was an 11 handle blow-off day. Therefore the chances that anyone was able to take advantage of this timing without getting stopped out for a loss is slim. Therefore, I counting this as a miss. You would have done much better selling the opening on 3/10, which we had, so that is a winner. 3/11 was a one day low. 3/16 was a very good high. 3/17 was close in price and one day past the 3/16 high. We had 3/18 and that was the low of the month, but again, due to the huge volatility, it is questionable whether there was a reasonable risk there. Fortunately, we also had 3/19 and if you went long on the 3/19 opening, that offered a relatively reasonable risk and very good trade. 3/23 was a short term high. 3/24 was close in price and one day past the 3/23 short term high.
Score – 8 out of 10 good dates = 80%.
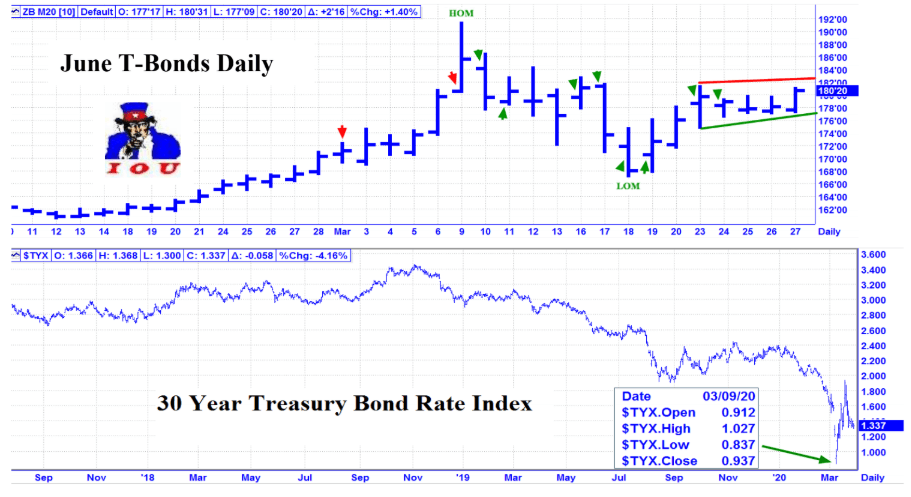
April Update – March saw an historic blow-off top for T-Bonds. The yield on the 30 year T-Bonds collapsed on 3/9, coinciding with the Full Moon at Perigee, falling to an unbelievable low .837 of 1% yield. Please see the TYX, the T-Bond 30 Year Rate Index chart below. Also, you may want to record, for future reference, that the June T-Bonds hit an all-time high of 191-22.
Looking ahead - with the current virus recession or possibly depression, there is a good chance that T-Bonds will have a rally to re-test the March high. Our T-Bond Fractal model indicates that may happen in late April. We have 4 major planetary change in trend windows for April. 4/3 AC – We have a triple major aspect hit to the US natal chart and Geo Jupiter 0 Pluto, a 12.45 year cycle. The US natal chart is a major factor for T-Bonds. The other major factor is Pluto, so this is HUGE. 4/7 AC 4/9 AC – 4/7 AC is a Full Moon at Perigee, Super Moon, repeating the Lunar pattern of meltdown Monday, March 9. 4/8 AC – 4/9 AC – This is a quadruple aspect hit to the US natal chart. 4/20 AC - the
Moon’s North Node 0 US Venus, is a very positive cycle peak for the US. 4/22 AC is a New Moon in Taurus. 4/24 AC has PLUTO in Capricorn turning Retrograde
Key Dates – 4/1, *4/6*, 4/8, 4/9, 4/13, 4/20, 4/21, 4/23, 4/27
This is an excerpt from the Astro Trend newsletter. Astro-Trend covers about thirty futures related markets including the major Financial Markets, such as the Stock Market, T-Bonds, Currencies, and most major commodities. We also offer intra day data which identifies potential change in trend points to the minute.
Author

Norm Winski
Independent Analyst
www.astro-trend.com


