Bitcoin BTCUSD Elliott Wave View Calling for Rally toward $15.000

Since all time high in December 2017, Bitcoin BTCUSD ( Value in US Dollar) dropped 70% before finally bottoming around $6590 on the 6th of February 2018. The big decline drove fear into the digital market as many new investors/traders lost their money during that period so they decided to stay away and avoid further losses because the mainstream media was again calling Bitcoin as a busted Bubble even though they were amazed by the Rise of Cryptocurrencies in 2017.
During the recent 2 months , Bitcoin daily confirmed transaction has been dropping significantly hitting 2 years low despite a +90% bounce seen in BTCUSD since February low. Data from different brokers show that current consumer desire to ‘hodl’ on to one’s bitcoins and watch the market, rather than cash out or convert into currencies.
Bitcoin Transaction per day since 2016
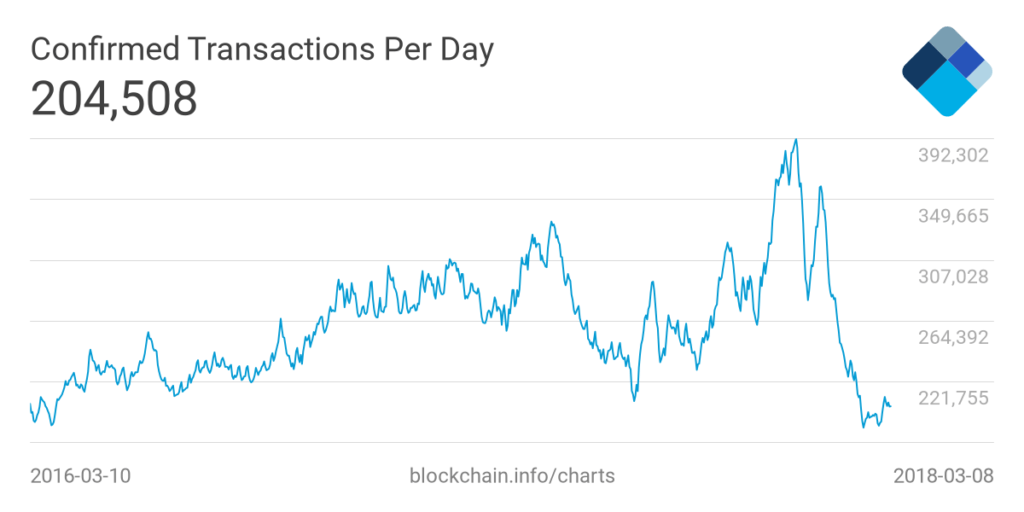
Therefore, the cryptocurrency market have been seeing lower volume in trading and cheaper fees which didn’t encourage investors yet to jump again into the digital world of Bitcoin which continued to struggle to regain its value as the sideways price action continue trapping it between $11.000 and $8.000.
Betting on the price of Bitcoin without owning any existed already by either using an unregulated futures exchanges or by trading the Bitcoin Investment Trust Fund (GBTC), which essentially functions as an ETF, and that was an early solution for people to avoid using directly bitcoin but those methods have failed to attract institutional investors until we saw the introduction of Bitcoin futures in CME and CBOE.
BTC Futures & ETF track the price of bitcoin despite some difference in time as the cryptocurrency market is always open ( 24 Hours , 7 days a week) while those instruments depends on the exchanges schedule which have fixes trading hours and may cause some gaps in price compared to the real data.
BTCUSD Overlay With BTC_F & GBTC
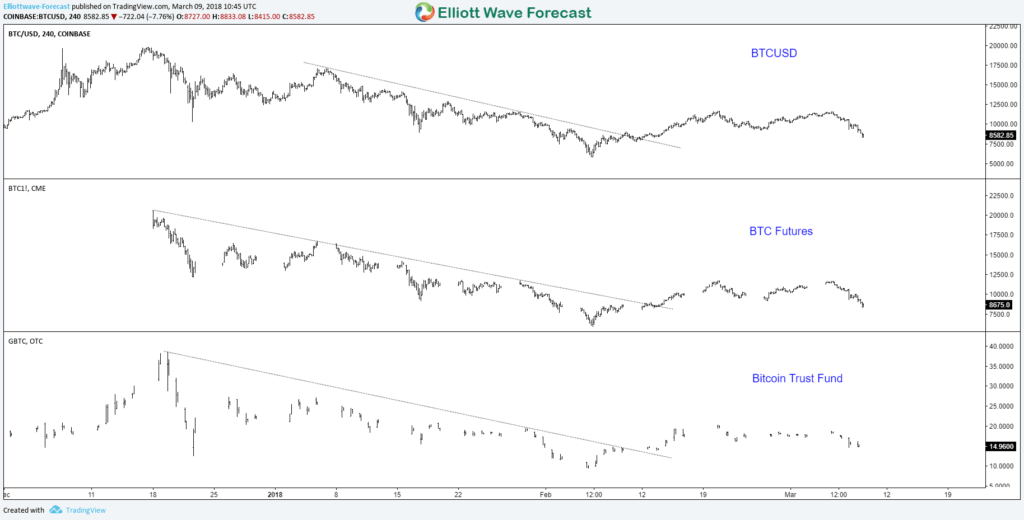
On the above chart, we notice the 3 instruments sharing the same cycles and swings which can allow regular traders to have exposure to this new market as it’s considered as another financial instrument. For that reason we’ll take a look at the current technical picture for Bitcoin Futures using Elliott Wave Theory:
BTC Futures 4H Chart 03.09.2018
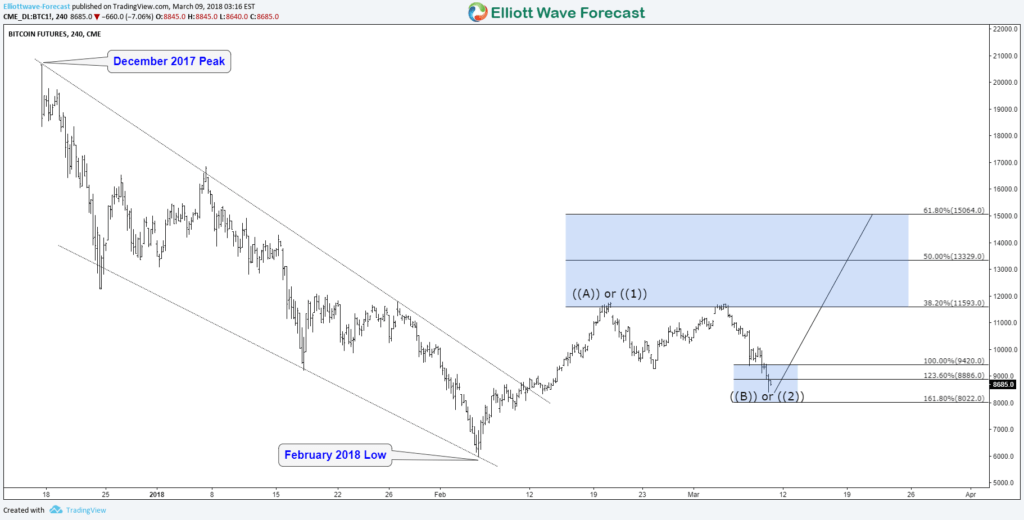
Since the introduction of Bitcoin futures in December 2017, the price dropped for 2 months before finally bottoming on February 2018. Up from there, the instrument started a new cycle to the upside meaning a wave ((1)) already in place and wave ((2)) currently ending around short term equal legs area $9420 – $8022, then it’s expected to resume the rally toward new highs. However Bitcoin could be also just doing a corrective 3 waves structure and the next leg higher will fail below the previous December peak.
Consequently, the two scenarios is suggesting at least another leg higher to take place which would be targeting the 50% – 61.8% Fibonacci retracement levels ( $13.329 – $15.064 ) of the previous decline then depending on the reaction from there we can decide how the next leg would occur.
Become a Successful Trader and Master Elliott Wave like a Pro. Start your Free 14 Day Trial at - Elliott Wave Forecast.
Author

Elliott Wave Forecast Team
ElliottWave-Forecast.com


