Australian Dollar Price Forecast: Next stop comes at 0.7280
- AUD/USD adds to the ongoing uptrend, surpassing the 0.7200 barrier.
- Spot now appears to have set sail toward the YTD peak around 0.7280.
- Investors are expected to follow the release of Chinese trade balance data.

AUD/USD waits for a clean break
Base case: while above the 200-day SMA near 0.6990, spot should maintain the constructive stance. Of note is that the pair is navigating close to the overbought zone (daily RSI flirting with 69), which has the potential to trigger a “technical” correction.
Against that, Australia’s relatively solid domestic fundamentals and the RBA’s hawkish stance should discourage aggressive selling, while bouts of fresh demand for the US Dollar (USD) and steady geopolitical uncertainty should keep bulls’ impulse contained for now.
Bullish case: A convincing move beyond 0.7200, ideally supported by firm Australian data, stronger expectations of another RBA rate increase, or an extended period of tighter-for-longer from the central bank, would strengthen this scenario.
That said, the next milestone is the 2026 ceiling at 0.7277 (May 6).
The persistence of speculative AUD shorts could add fuel to the move if a confirmed breakout forces bearish traders to unwind their positions.
Bearish case: A sustainable retracement to the sub-0.7100 region, amid a resurgence of USD strength or generalised weakness in market sentiment, would bring sellers back into the market, with subsequent targets emerging at the provisional 100-day and 55-day SMAs near 0.7080 and 0.7030, respectively. South from here lies the more relevant 200-day SMA.
A daily close below this area would damage the wider positive structure and increase the probability of a deeper correction.
Australia’s economy keeps the downside cushioned
Australia’s domestic backdrop remains relatively healthy, supported by firm demand, positive growth and a somewhat resilient labour market.
August final business surveys reinforced that picture after the Manufacturing PMI held steady at 52.0, and the Services PMI lost some momentum, falling marginally to 53.2 from 53.6. Despite the mixed performance, the domestic business activity remains comfortably in expansionary territory.
The July data from the labour market were, however, discouraging: the Unemployment Rate ticked higher to nearly 5-year highs at 4.5%, while the Employment Change unexpectedly dropped by 15.8K following a revised 80.3K increase in June.
The picture remains, meanwhile, broadly auspicious after Australia recorded an A$1.923 billion trade surplus in July, adding to June’s A$2.341 billion positive results.
In addition, the latest GDP figures showed the economy expanded by 0.4% QoQ (from 0.3%) in the April-June period, while annual growth came in at 2.1% (from 2.5%).
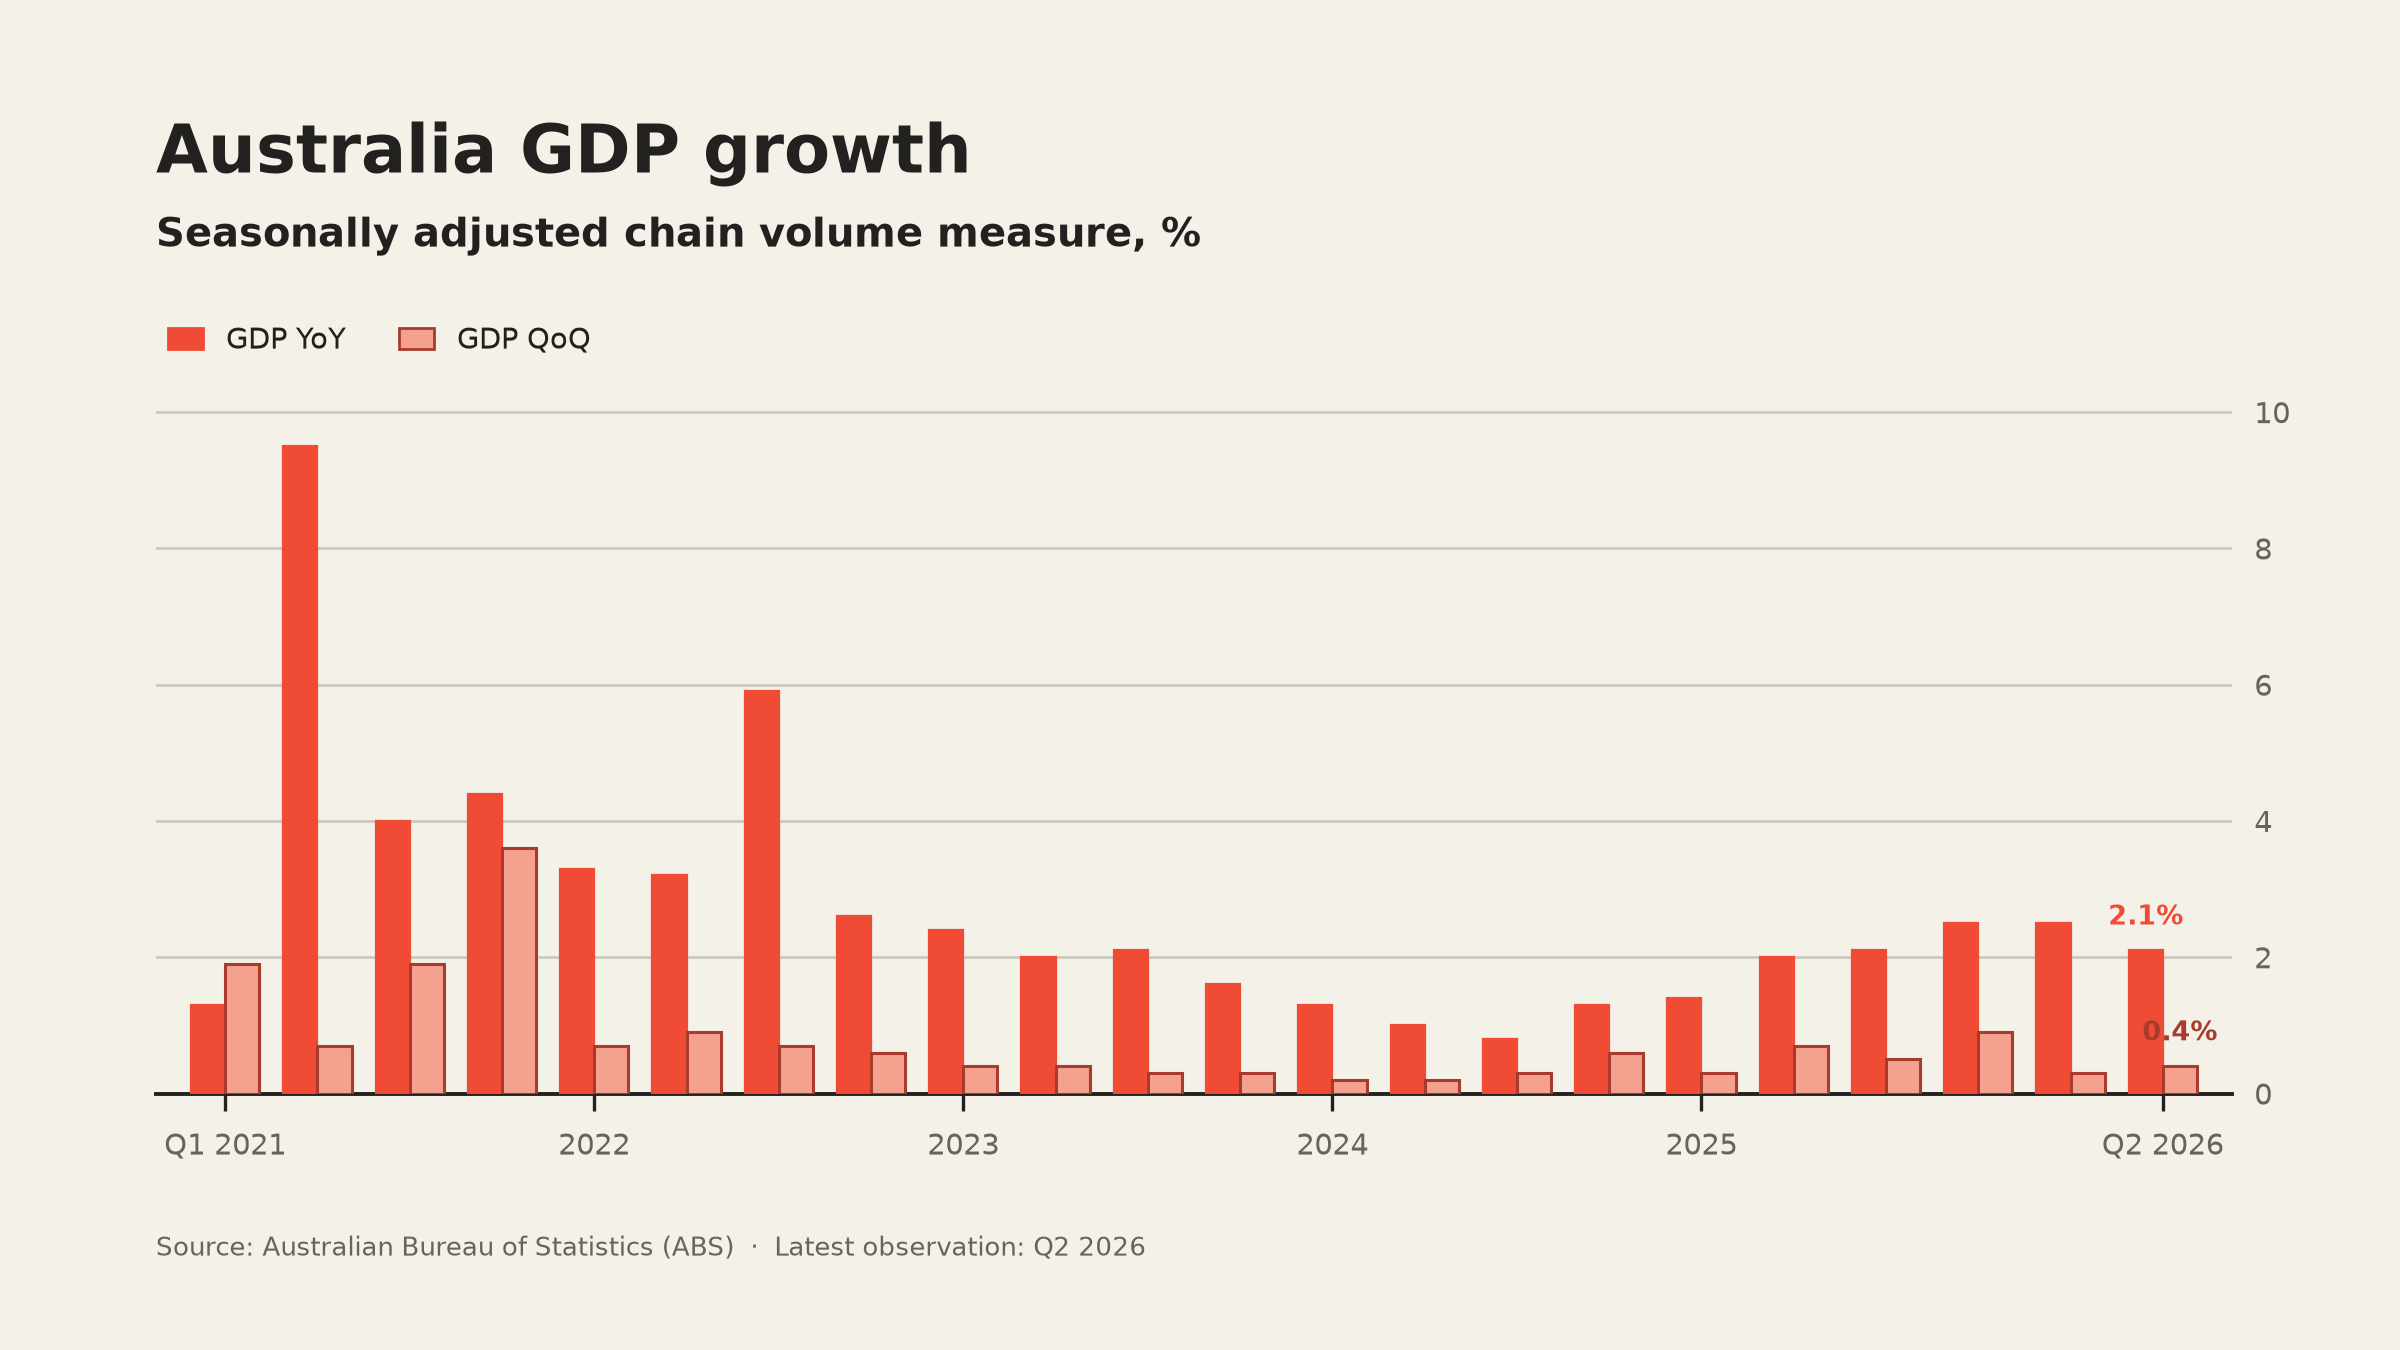
Overall the figures suggest a resilient economy but perhaps not strong enough on its own to trigger a sustained breakout in spot.
Sticky inflation keeps the RBA on alert
Australian headline inflation eased to 3.5% in July (from 3.8%), while underlying price pressures tracked by the Trimmed Mean held steady at 3.6%.
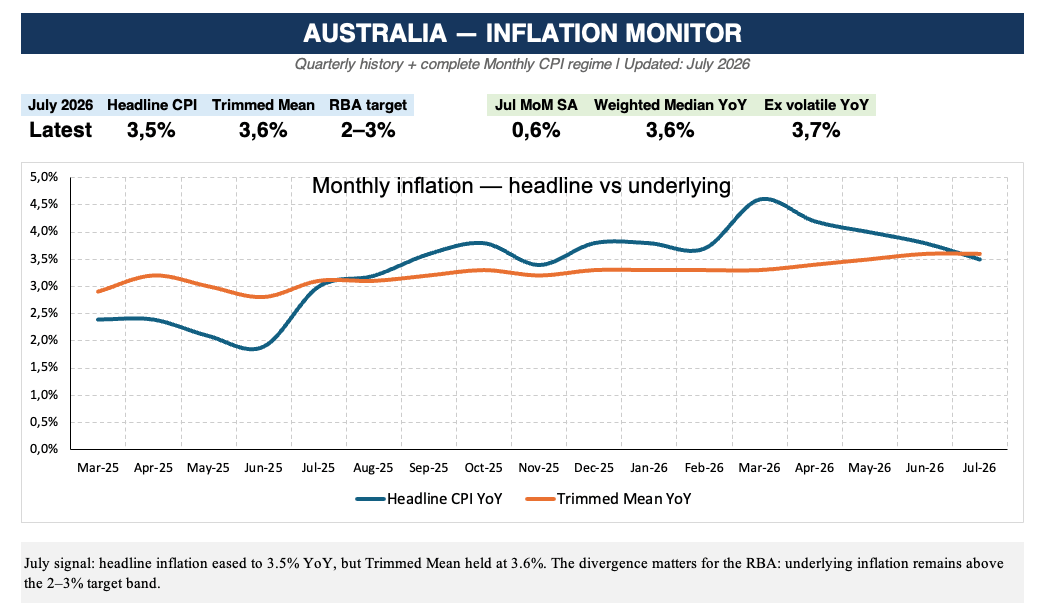
Consumer inflation expectations reinforced the view of sticky prices after they ticked higher to 4.9% in August (from 4.7%), according to the Melbourne Institute. All in all, inflation remains too high for the RBA to declare victory.
Back to the RBA, it left its Official Cash Rate (OCR) unchanged at 4.35% in August, delivering another cautious message. Policymakers warned that further tightening could still be required if inflation proves more persistent than expected.
Later, the RBA Minutes pointed in that direction, retaining a cautious but hawkish bias, with several policymakers warning that upside inflation risks could materialise and leave the Board ready to raise rates. Indeed, risks include higher oil prices, cost pass-through and the data centre boom.
The Board debated a 25-basis-point hike but ultimately judged current policy sufficiently restrictive. With fresh inflation, labour-market and GDP data due before September, policymakers also noted balanced risks, including falling housing prices and the possibility of reducing inflation with less damage to employment.
In the meantime, market participants expect just over 4 basis points of tightening by year-end, while consensus appears slightly tilted toward another 25-basis-point rate hike at its September 29 meeting.
China offers support, but not momentum
China remains an important influence on the Australian currency, although it is currently providing stability rather than a powerful tailwind.
The Chinese economy expanded by 4.3% YoY in the April-June period, while Industrial Production has lost some traction and rose by 4.5% in the year to June, and Retail Sales increased by a modest 0.6% over the last twelve months.
Business surveys indicate divergent activity: the National Bureau of Statistics (NBS) reported Manufacturing PMI at 49.8 in August (from 49.2) and Services at 49.0 (unchanged), while private measures like RatingDog remain in expansionary territory, with Manufacturing at 51.5 (from 50.9) and Services at 51.4 (from 50.4).
China’s trade surplus also widened to $125.62 billion in June from $105.4 billion, supported by stronger imports and exports.
Meanwhile, the People’s Bank of China (PBoC) maintained its Loan Prime Rates (LPR) unchanged at its meeting last month, with the one-year rate at 3.00% and the five-year rate at 3.50%, widely in line with the analysts’ estimates.
China is therefore neither delivering a major boost nor creating a significant drag. Unless the data reveal a clearer acceleration or deterioration, Chinese releases may generate short-term volatility without establishing a lasting direction for the pair.
Specs shorts ease as bearish conviction loses steam
AUD bearish positioning eased in the week ending September 1, as per the latest report from the Commodity Futures Trading Commission (CFTC). Indeed, net speculative positioning improved by more than 5K contracts to around 39.4K, reversing the previous week’s marginal deterioration. In the same line, the 4-week change improved to -6,216 from -4,491, indicating that the broader negative positioning has been losing further ground.
Additionally, open interest increased sharply by almost 57.8K contracts to around 391.7K. This combination of a sizeable rise in participation and a reduction in net shorts suggests that the move was driven by a mix of short covering and fresh long exposure, rather than a broad withdrawal from the Australian currency.
Furthermore, speculative exposure improved to -10.1% from -13.3%, although its percentile remained elevated at 81.6. This indicates that bearish AUD exposure is still historically significant. The net-position percentile rose to 68.1, but it remains below levels associated with extreme positioning.
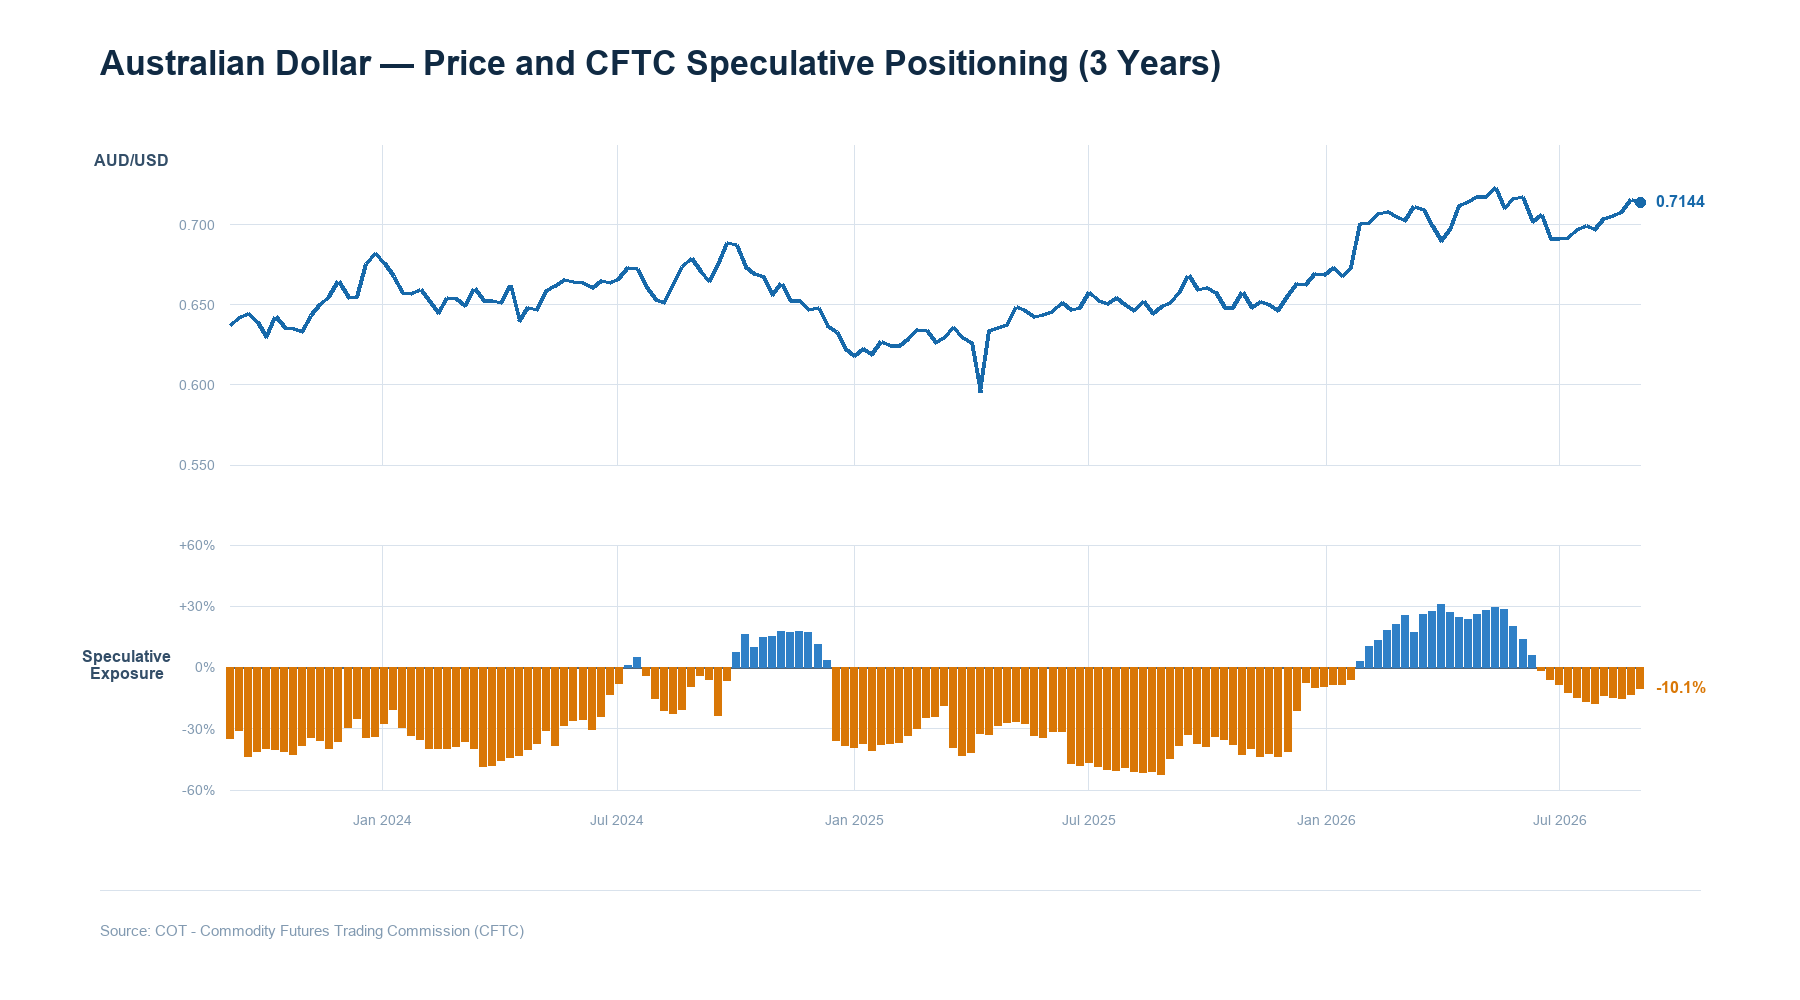
Overall, the AUD’s bearish bias moderated meaningfully, with stronger participation lending some credibility to the improvement. Nevertheless, the still elevated exposure percentile suggests that this is, for now, an easing of bearish conviction rather than a confirmed bullish reversal.
Australian data return to centre stage
Next on tap on the domestic calendar is the publication of Westpac’s Consumer Confidence index, seconded by Building Permits, Private House Approvals and the Business Confidence gauge tracked by NAB. In addition, it will be worth following the speeches by the RBA’s Hunter and Hauser.
In addition to the data in Oz, traders will also be watching for the publication of the August Trade Balance results in China.
Technical analysis
In the daily chart, AUD/USD trades at 0.7218. The pair holds a clear bullish bias as it extends above the 55-day, 100-day and 200-day simple moving averages (SMAs), which cluster between roughly 0.70 and 0.71 and now underpin the advance. The Relative Strength Index (RSI) at about 68 sits near overbought territory, while the Average Directional Index (ADX) around 23 suggests a maturing but still moderate trend, hinting that upside momentum persists but could be prone to consolidation.
On the topside, immediate resistance emerges at 0.7278, ahead of the nearby horizontal barrier at 0.7283; a sustained break above this zone would open the way toward the next key resistance around 0.7661. On the downside, initial support is seen at the 0.7079 area, reinforced by a nearby horizontal floor and the 100-day SMA, with the 0.7030–0.7035 region and the 55-day SMA providing a secondary cushion; below there, deeper support is aligned at 0.6833 and then 0.6660, where the broader bullish structure would come into question.
(The technical analysis of this story was written with the help of an AI tool. Know more.)
AUD/USD needs 0.7200 to unlock the next leg higher
AUD/USD retains a constructive medium-term structure above its 200-day SMA, but the immediate outlook remains uncertain while the pair struggles to secure a foothold well above the 0.7200 yardstick.
The most attractive setup remains conditional: confirmed acceptance above 0.7200 would favour further gains and could trigger a positioning-driven short squeeze. Another rejection, however, would leave the pair exposed to a breach below 0.7100.
Until one of these boundaries breaks, AUD/USD remains caught between supportive Australian fundamentals and an external backdrop still dominated by the US Dollar, geopolitical uncertainty and only moderate support from China.
US-China Trade War FAQs
Generally speaking, a trade war is an economic conflict between two or more countries due to extreme protectionism on one end. It implies the creation of trade barriers, such as tariffs, which result in counter-barriers, escalating import costs, and hence the cost of living.
An economic conflict between the United States (US) and China began early in 2018, when President Donald Trump set trade barriers on China, claiming unfair commercial practices and intellectual property theft from the Asian giant. China took retaliatory action, imposing tariffs on multiple US goods, such as automobiles and soybeans. Tensions escalated until the two countries signed the US-China Phase One trade deal in January 2020. The agreement required structural reforms and other changes to China’s economic and trade regime and pretended to restore stability and trust between the two nations. However, the Coronavirus pandemic took the focus out of the conflict. Yet, it is worth mentioning that President Joe Biden, who took office after Trump, kept tariffs in place and even added some additional levies.
The return of Donald Trump to the White House as the 47th US President has sparked a fresh wave of tensions between the two countries. During the 2024 election campaign, Trump pledged to impose 60% tariffs on China once he returned to office, which he did on January 20, 2025. With Trump back, the US-China trade war is meant to resume where it was left, with tit-for-tat policies affecting the global economic landscape amid disruptions in global supply chains, resulting in a reduction in spending, particularly investment, and directly feeding into the Consumer Price Index inflation.
Author

Pablo Piovano
FXStreet
Born and bred in Argentina, Pablo has been carrying on with his passion for FX markets and trading since his first college years.

















