|

AUD/USD found sellers after Elliott Wave double three pattern

In this technical article, we’ll take a look at the AUDUSD Elliott Wave charts published in our members’ area. As our members know, AUDUSD has been trading within a cycle that started at the 0.7236 peak. Recently, the pair completed a clear three-wave recovery, forming an Elliott Wave Double Three pattern. As expected, sellers stepped in, pushing the price lower.

In this update, we’ll break down the Elliott Wave structure and examine the near-term outlook for AUDUSD. Before looking at the real market example, let’s first explain the Double Three pattern and how it works within the Elliott Wave framework.

Elliott Wave double three pattern

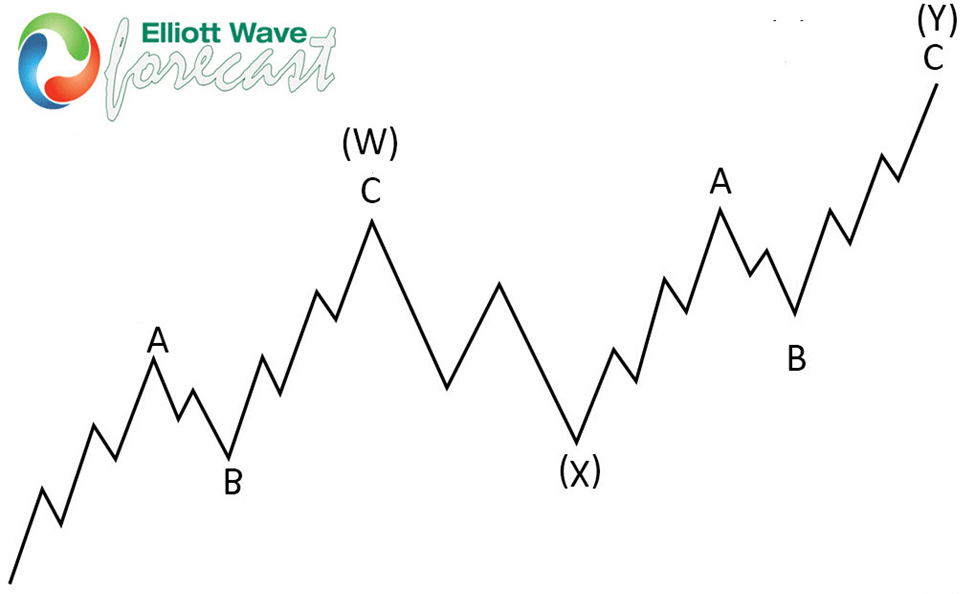
Double three is the common pattern in the market , also known as 7 swing structure. It’s a reliable pattern which is giving us good trading entries with clearly defined invalidation levels.
The picture below presents what Elliott Wave Double Three pattern looks like. It has (W),(X),(Y) labeling and 3,3,3 inner structure, which means all of these 3 legs are corrective sequences. Each (W) and (Y) are made of 3 swings , they’re having A,B,C structure in lower degree, or alternatively they can have W,X,Y labeling.
Chart

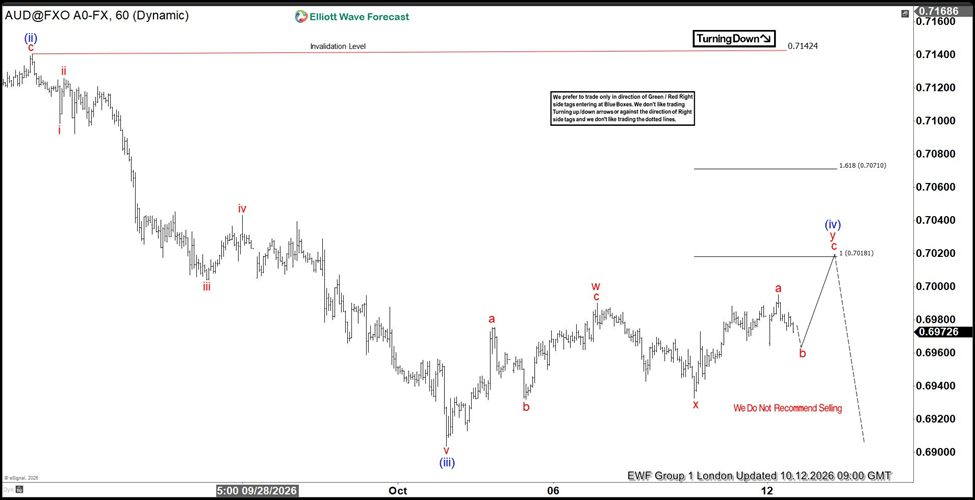
AUD/USD Elliott Wave One-hour chart 10.12.2026

AUDUSD is correcting the cycle from the 0.7142 peak, with wave (iv) still in progress. The current structure suggests an Elliott Wave Double Three pattern, with one more leg higher needed to complete the seven swings. At Elliott Wave Forecast, we use the Equal Legs technique to identify high-probability trading zones. By projecting the 1.0–1.236 Fibonacci extension of wave w from the end of wave x, we identified a potential sellers’ zone around 0.7018 area.
Chart

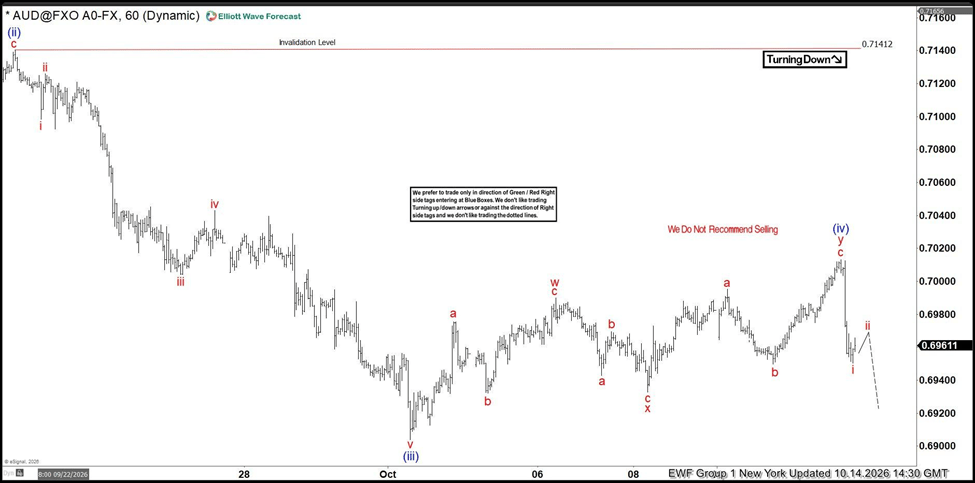
AUD/USD Elliott Wave one-hour chart 10.12.2026

AUDUSD came within just a few points of the 0.7018 Equal Legs zone before reversing lower, completing the Double Three pattern early. Sellers stepped in aggressively, and we now expect a retest of the previous low. A break below that level would confirm the bearish outlook, opening the way toward the next downside target at 0.6878–0.6836.
Chart

Author

Elliott Wave Forecast Team

Elliott Wave Forecast Team

ElliottWave-Forecast.com

More from Elliott Wave Forecast Team
Share:

Editor's Picks

AUD/USD keeps the red near 0.6950 after weak Aussie jobs data

AUD/USD holds losses near 0.6950 on disappointing Australian jobs data, extending the previous day's retracement slide from the monthly high and hitting a fresh weekly low during Thursday’s Asian session. Meanwhile, declining US bond yields drag the US Dollar away from the April 2025 high, touched after Wednesday's hot US CPI, helping limit losses for the currency pair.

USD/JPY slides back below 158.00 as USD reverses post-CPI gains

USD/JPY extends the previous day's pullback from a three-week high, attracting follow-through selling and sliding below 158.00 during Thursday's Asian session. Traders remain on high alert amid speculation that authorities will step in to prop up the Japanese Yen. The US Dollar, meanwhile, reverses Wednesday's hot CPI-led gains to April 2025 highs as US bond yields retreat on China bond-buying talk, further pressuring the pair.

Gold shrugs off hot US PPI as risk aversion drives bond yields lower

Gold attracts fresh buying on Thursday as weakness across global equities, driven by mounting concerns over AI-related investments, triggers a sharp pullback in US Treasury yields and drags the US Dollar lower from fresh year-to-date highs.

Ripple clings to $1.30 support as downside risks intensify

Ripple is stuck in a bearish trend, trading near $1.30 on Thursday. The remittance token’s bearish shift reflects the broader cryptocurrency market, which remains under heavy selling amid concerns about accelerating inflation in the US.

Budget preview: Is Healey impressing the bond market?

There is less than 2 weeks to go before the Chancellor delivers his first budget. Unusually for the UK, the economic and financial backdrop to this budget is upbeat. UK bonds have been rallying, the FTSE 100 is the top performing major stock index this week, and the Pound is also stabilising versus the Dollar.

Has Bitcoin really escaped the macro forces it was built to fight?
Over 17 years ago, Satoshi Nakamoto designed Bitcoin (BTC) on the back of a global financial crisis as an alternative to the global monetary system outside the control of central banks, governments and traditional intermediaries. This raises a key question: has Bitcoin really become independent of the macroeconomic forces it was built to challenge?
















