AUD/USD: an interesting battle between Double Bottom and Head and Shoulder

AUD/USD produced a bullish engulfing candle last Friday on the daily chart. The candle bounced at double bottom support. The price is on consolidation at a level of resistance. If it gets breached, the next level of resistance is far enough. This offers a lucrative risk-reward for the daily buyers to go long on the pair. Today’s major intraday charts have been bullish as well. Thus, the pair may end up having another bullish day today. On the other hand, the daily chart shows that the pair is on the last wave to produce a head and shoulder, which makes things interesting.
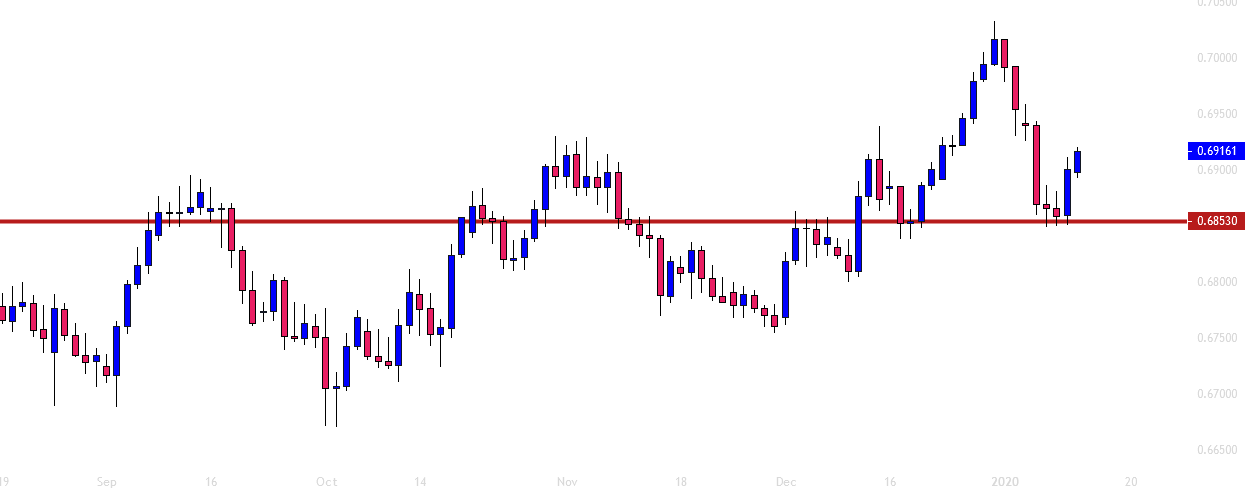
The chart shows that the price had a bounce at the level of 0.68350 earlier. Last Friday, the price had another bounce and produced an engulfing daily candle. Also, the price reacted at the level of 0.69125 earlier. Thus, it may work as a level of resistance again. However, if the intraday charts make a breakout at this level, the daily buyers may push the price towards the level of 0.70200. On the other hand, if the level produces a daily bearish reversal candle, the daily chart may end up producing a head and shoulder pattern. In that case, the price may head towards the level of 0.68000, as mentioned that major intraday charts have been bullish. Let us now have a look at those.
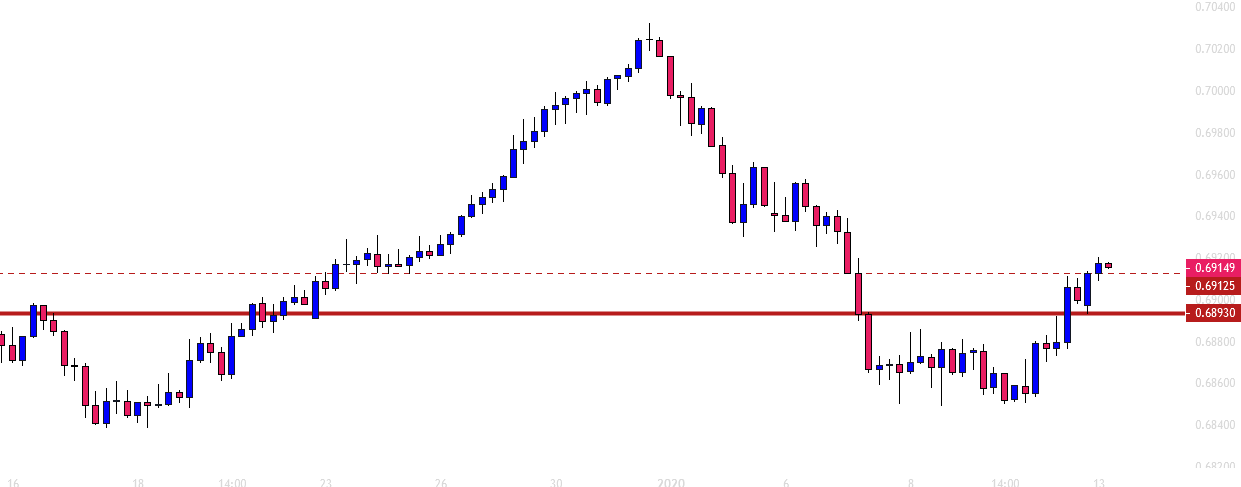
The chart shows that the price has been heading towards the North with good bullish momentum. It consolidated and produced a bullish engulfing candle at the level of 0.68930. The next candle made the breakout. Thus, the price may consolidate again before heading towards the North. If it continues searing its support and comes at the level of 0.68930, the sellers may wait for a bearish breakout to go short on the pair. Otherwise, the pair looks good for the buyers so far.
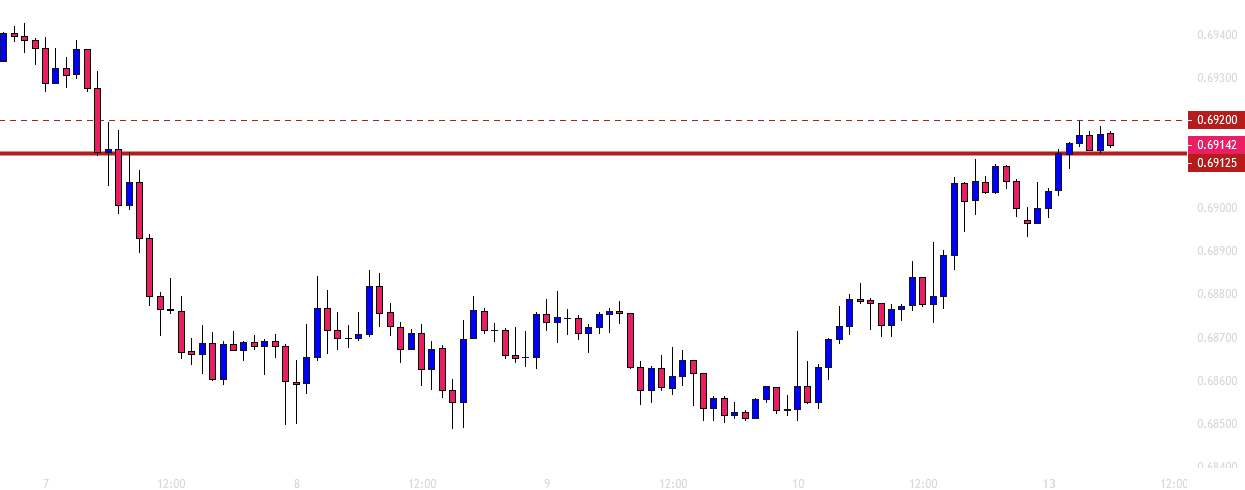
The H1 chart shows that the price has been on consolidation for the last three hours. The level of 0.69125 has been the level of support. If the level holds the price and pushes it towards the North to make a breakout at the level of 0.69200, the H1 buyers may go long on the pair. The price may find its next resistance at the level of 0.69400. A bearish breakout at the level of 0.69125 may drive the price towards the level of 0.68970.
All these three charts suggest that AUDUSD traders may have a busy day today. The bull has the upper hand, though. However, the bear may come and change all the equations since the daily chart may end up producing a head and shoulder as well.
Author

EagleFX Team
EagleFX
EagleFX Team is an international group of market analysts with skills in fundamental and technical analysis, applying several methods to assess the state and likelihood of price movements on Forex, Commodities, Indices, Metals and


