As said, the SP500 grind higher goes on

Yesterday’s sizable bullish gap immediately came under attack by the sellers – no panicking though as I kept riding the bull to the glorious close and beyond. In such moments, it’s key to focus on what has changed, and what has not. The obvious conclusion has been that we have seen nothing really new under the sun.
So, will the sizable open profits keep growing further? In my humble opinion, it’s virtually guaranteed.
SP500 in the Short-Run
Let’s start with the daily chart perspective.
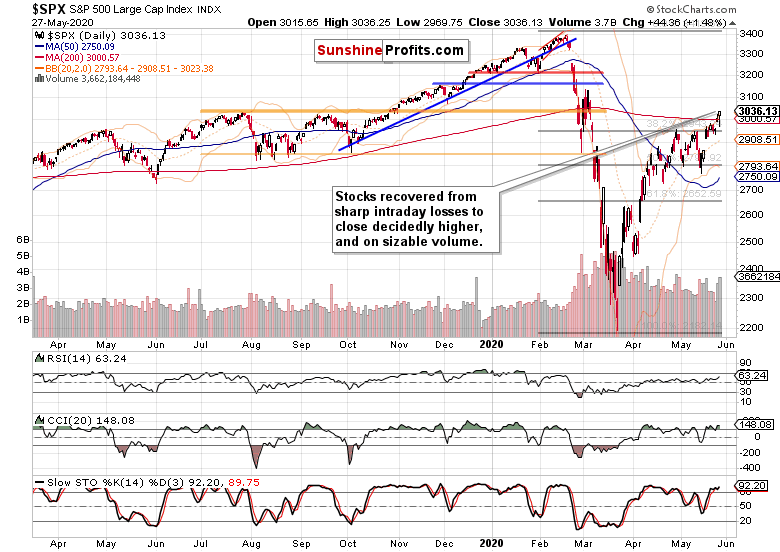
The bears went on the offensive right after the bullish open, but the bulls responded as anticipated, and the high daily volume reveals the extent of the buying pressure. Yes, the initiative appears to be firmly with the bulls, but why exactly have I said that the buyers responded as anticipated?
Yesterday’s intraday Stock Trading Alert provides the answer:
(…) However unpleasant it might be to see the bullish opening gap closed, the key point to highlight is that the high yield corporate bonds (HYG ETF) hasn't really declined below yesterday's closing prices.
Such a move has been rejected, and the ETF now trades at $82 - and I expect stocks to at least timidly follow up higher later today, and more vigorously over the coming sessions.
What we have seen right after the open, was probably a US-China tensions driven onset of selling pressure - an event of fleeting nature as the ensuing price action showed.
And stocks caught up still yesterday, reversing powerfully higher. To illustrate the extent of the bullish turn, let’s check the market breadth indicators.
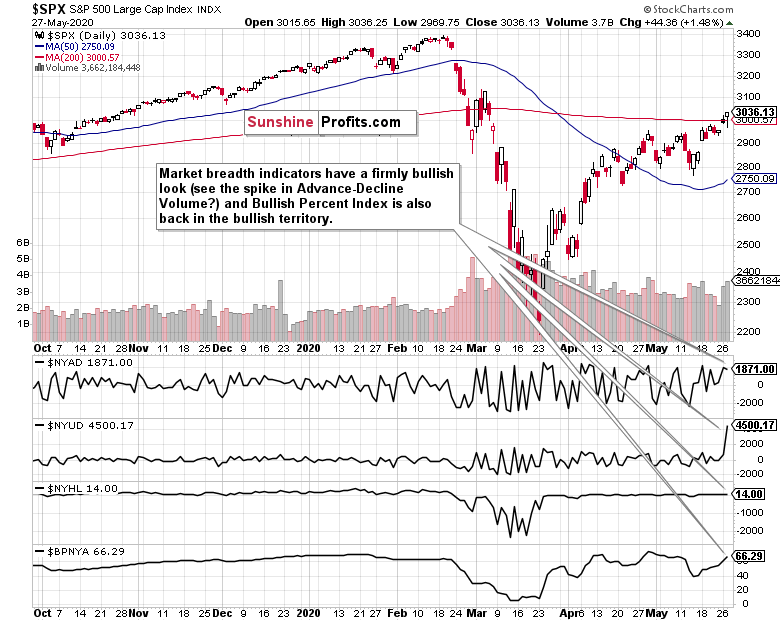
It hasn’t been only the advance-decline volume that just flipped profoundly bullish. The advance-decline line has been showing where the odds in the battle to overcome the 61.8% Fibonacci retracement and other resistances lie – with the bulls. The bullish percent index is also solidly back supporting the buyers these days.
Let’s check yesterday’s action in the credit markets next.
The Credit Markets’ Point of View
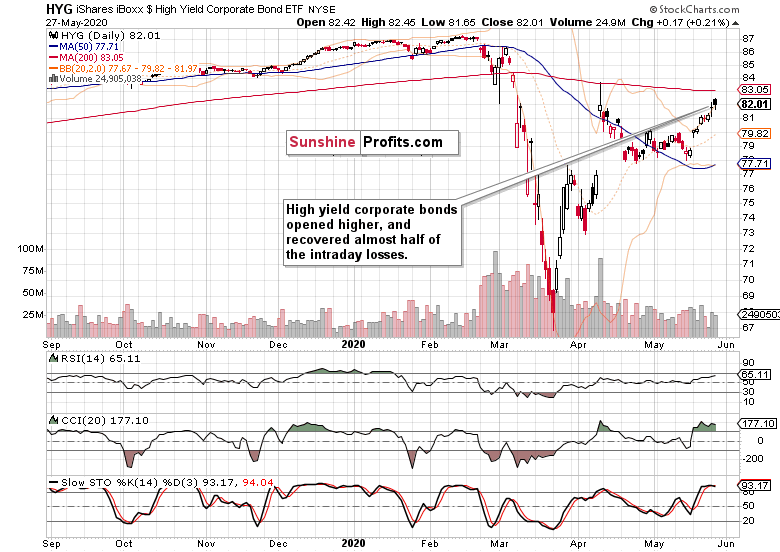
High yield corporate bonds (HYG ETF) stood the ground and refused to move below yesterday’s closing prices. The uptrend in junk corporate bonds goes on, supporting higher stock prices. While a consolidation of recent sharp gains wouldn’t come as a surprise, we could have seen one yesterday already. And even if not, this leading metric of credit market health is still primed to go higher and serve as a tailwind for stocks over the coming days and weeks.
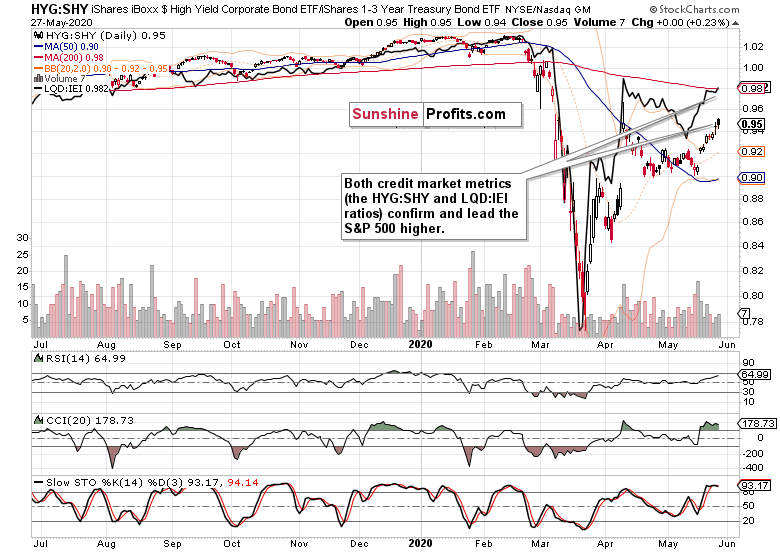
The above chart shows that both key credit market ratios, the high yield corporate bonds to short-term Treasuries (HYG:SHY) and the investment grade corporate bonds to longer-dated Treasuries (LQD:IEI), confirm each other’s upswings. Such a lockstep move doesn’t reveal any cracks in the stock market bull run.
Key SP500 Sectors and Ratios in Focus
Technology (XLK ETF) reversed all intraday losses, and rose on high volume yesterday. The sizable lower shadow underscores the buying interest, boding well for higher prices of the sectoral ETF. And as tech leads the stock market itself, the bullish takeaway is valid also for the S&P 500.
The intraday bullish reversal was mirrored in healthcare (XLV ETF) as well, supporting prospects of more gains to come. And the same goes for financials (XLF ETF) and consumer discretionaries (XLY ETF) too. The key sectors are aligned for more gains ahead, and quite likely shortly.
Among the leading ratios, financials to utilities (XLF:XLU) has indeed broken above the declining resistance line formed by its April highs (and also above those highs themselves) – just as I expected it to. The bullish picture is made complete by the consumer discretionaries to staples ratio (XLY:XLP) that has refused to turn south, and continues to trade within spitting distance of its recent highs.
As for the stealth bull market trio, all three - energy (XLE ETF), materials (XLB ETF) and industrials (XLI ETF) - refused to decline yesterday. That’s a uniformly bullish sign, with the materials and industrials having led the move higher on the day.
Summary
Summing up, yesterday’s selling didn’t stick, and the buyers predictably took over the reins. Less and less in terms of resistances is standing in the bulls’ way and the challenge of the early March highs is slowly but surely drawing nearer. Both the credit market and sectoral analysis favor this bullish takeaway. So does the Russell 2000 upswing as the smallcaps have reversed higher just as powerfully as the S&P 500 did.
I expect stocks to slowly grind higher overall despite the high likelihood of sideways-to-slightly-down trading over the summer – but we’re nowhere near the start thereof. Right now, the breakout above the three key resistances (the 61.8% Fibonacci retracement, the upper border of the early March gap, and the 200-day moving average) is still unfolding with the bears running for cover and FOMO (fear of missing out) back in vogue. In short, the ball remains in the bulls’ court.
Want free follow-ups to the above article and details not available to 99%+ investors? Sign up to our free newsletter today!
Want free follow-ups to the above article and details not available to 99%+ investors? Sign up to our free newsletter today!
Author

Monica Kingsley
Monicakingsley
Monica Kingsley is a trader and financial analyst serving countless investors and traders since Feb 2020.