A strategy that beats the S&P 500 over 35-years

S2N spotlight
I came across a strategy where a quant doing amazing things in the newsletter and algorithmic space shared a post highlighting this strategy with a twist. I have been thinking about this for a week, and I am not sure I am in agreement with his analysis on this occasion. However, I still think there is value in the core idea. So let me lay it out, and then address some of my concerns.
As you can see below, the strategy produces an annualised return of 12.86% versus the S&P 500’s 8.68%. The strategy has a much higher Sharpe ratio.
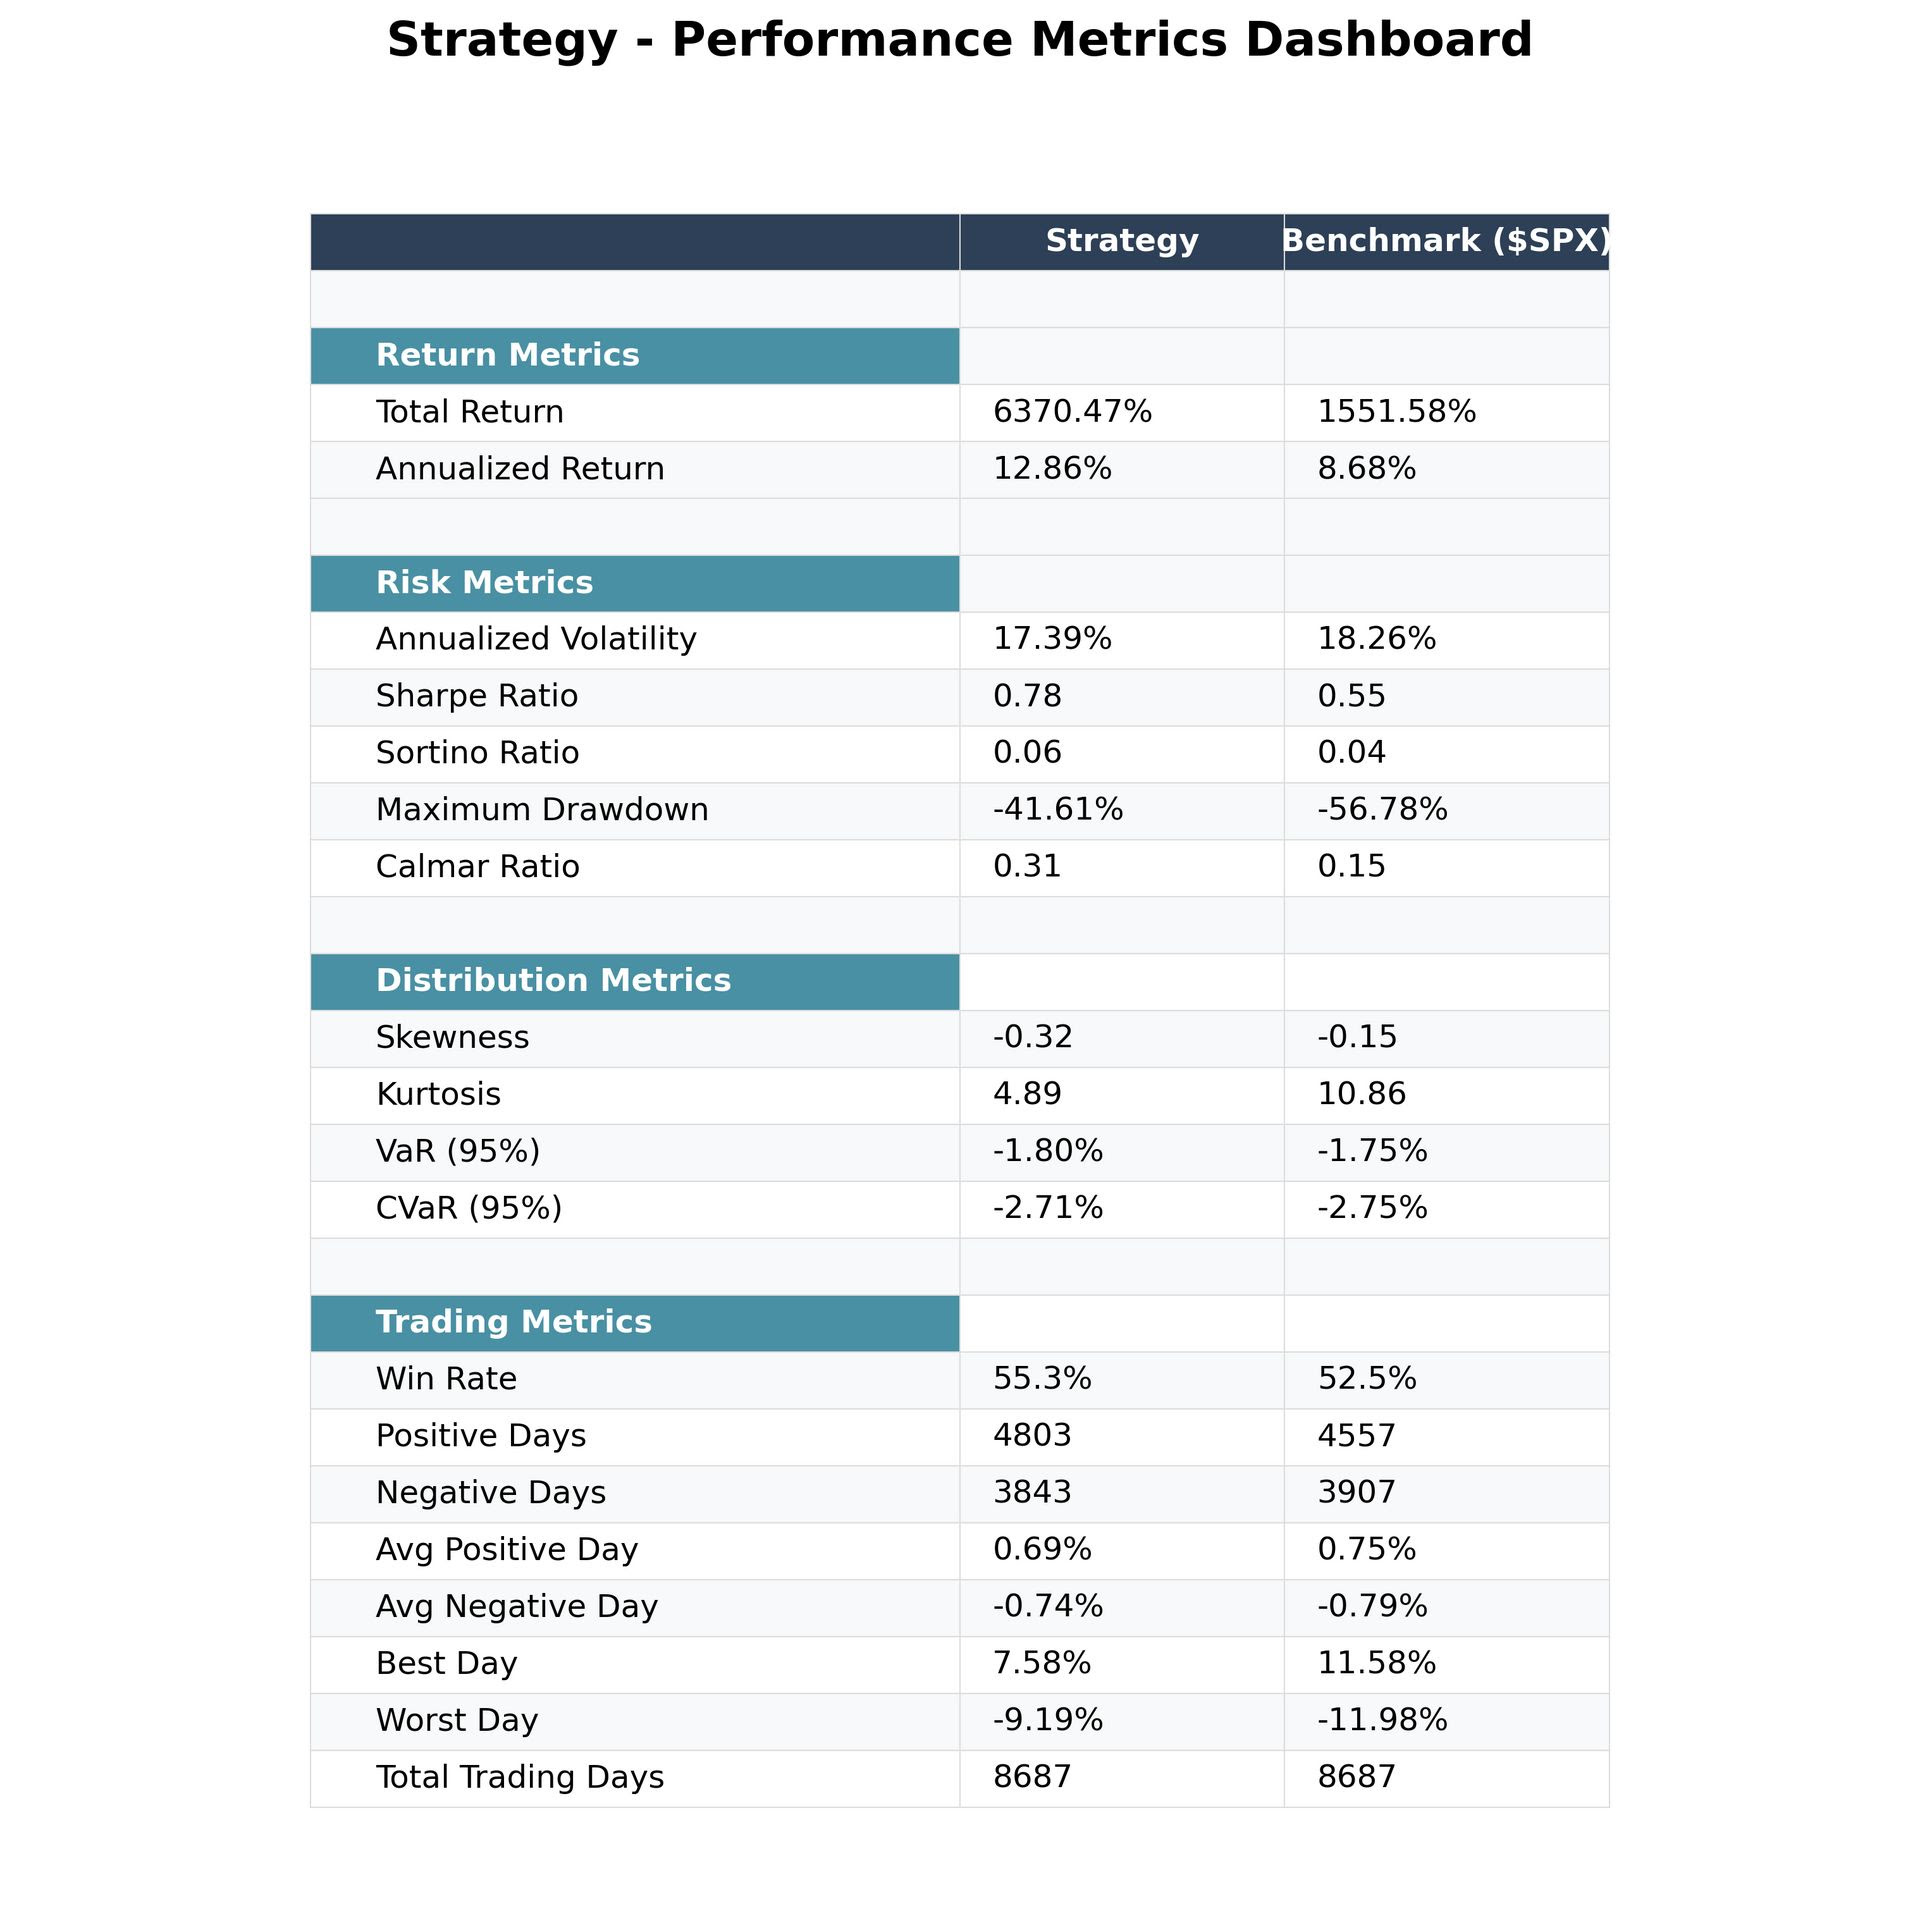
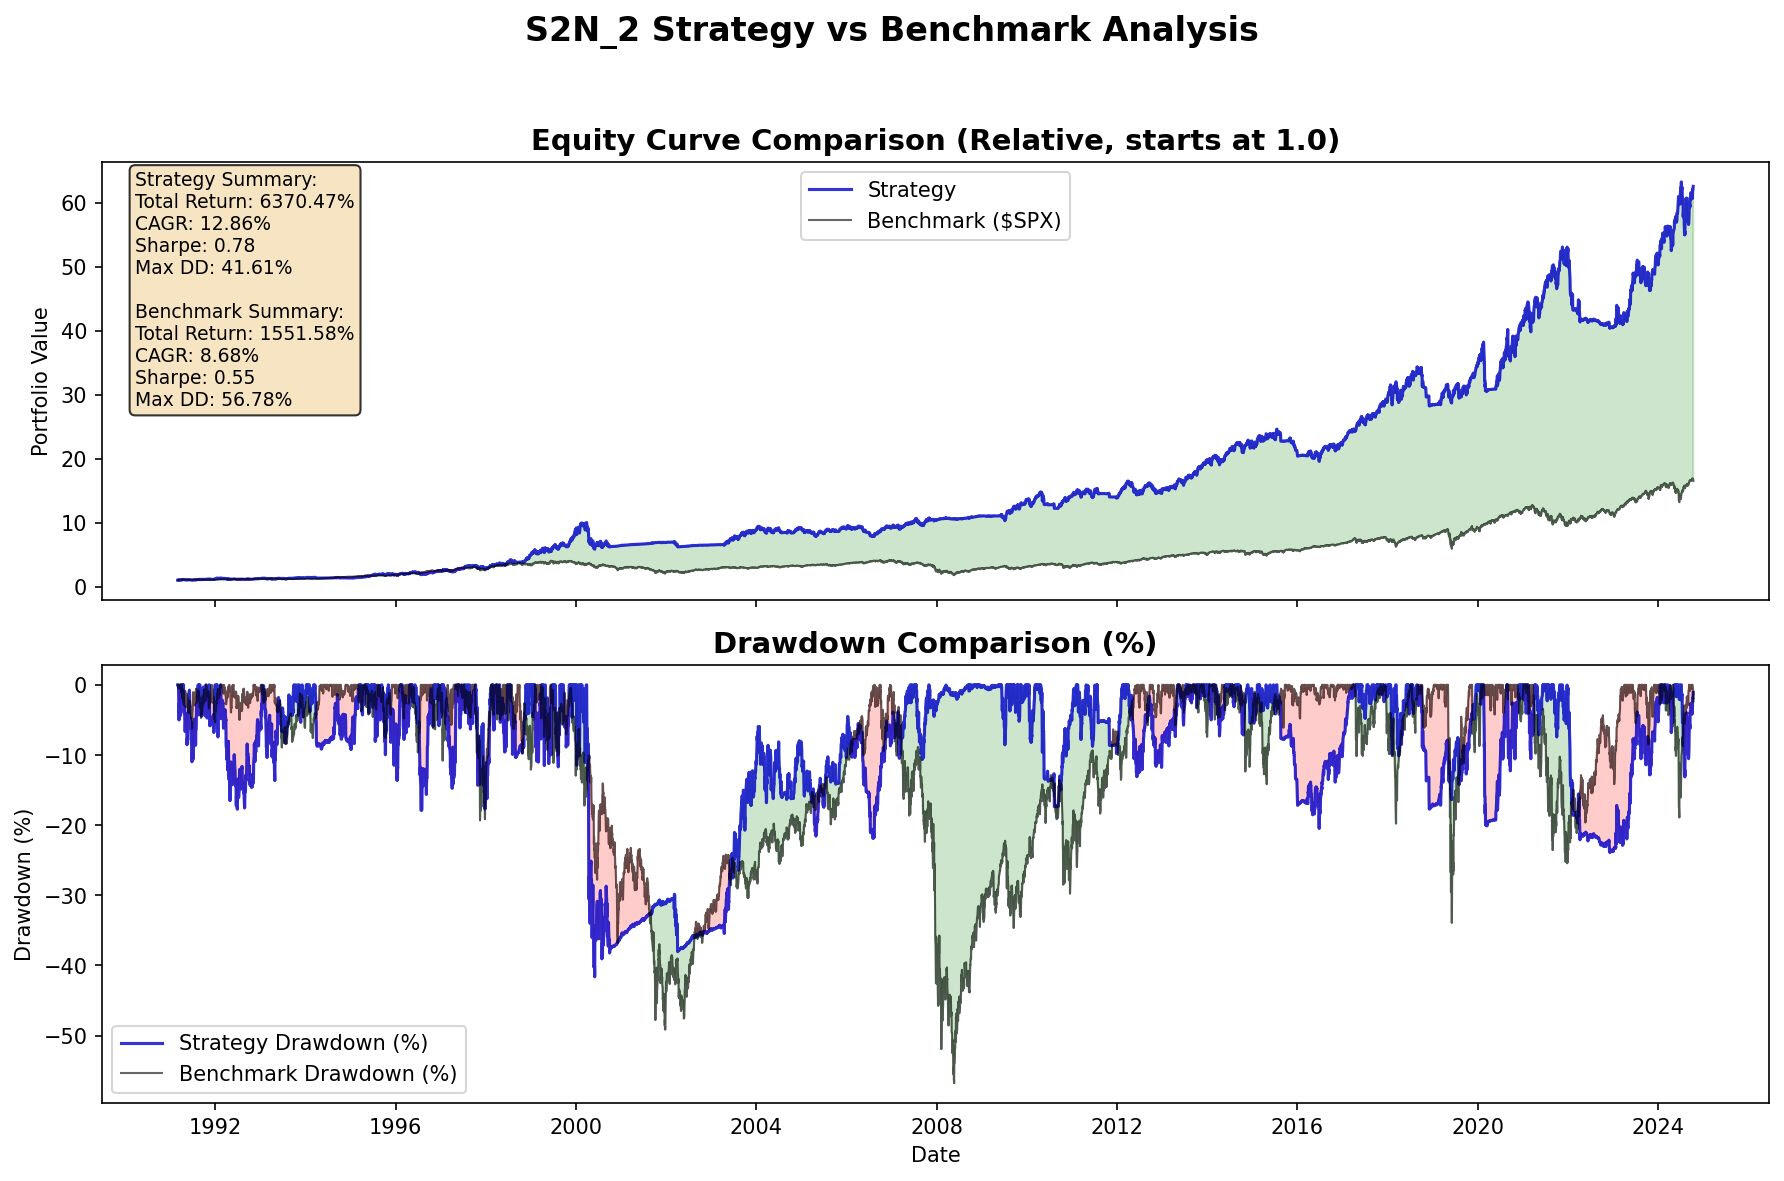
I think the visual comparison of the strategy vs. the benchmark is a nice way to see the outperformance. By now you should be begging me for the strategy. Isn’t this amazing?
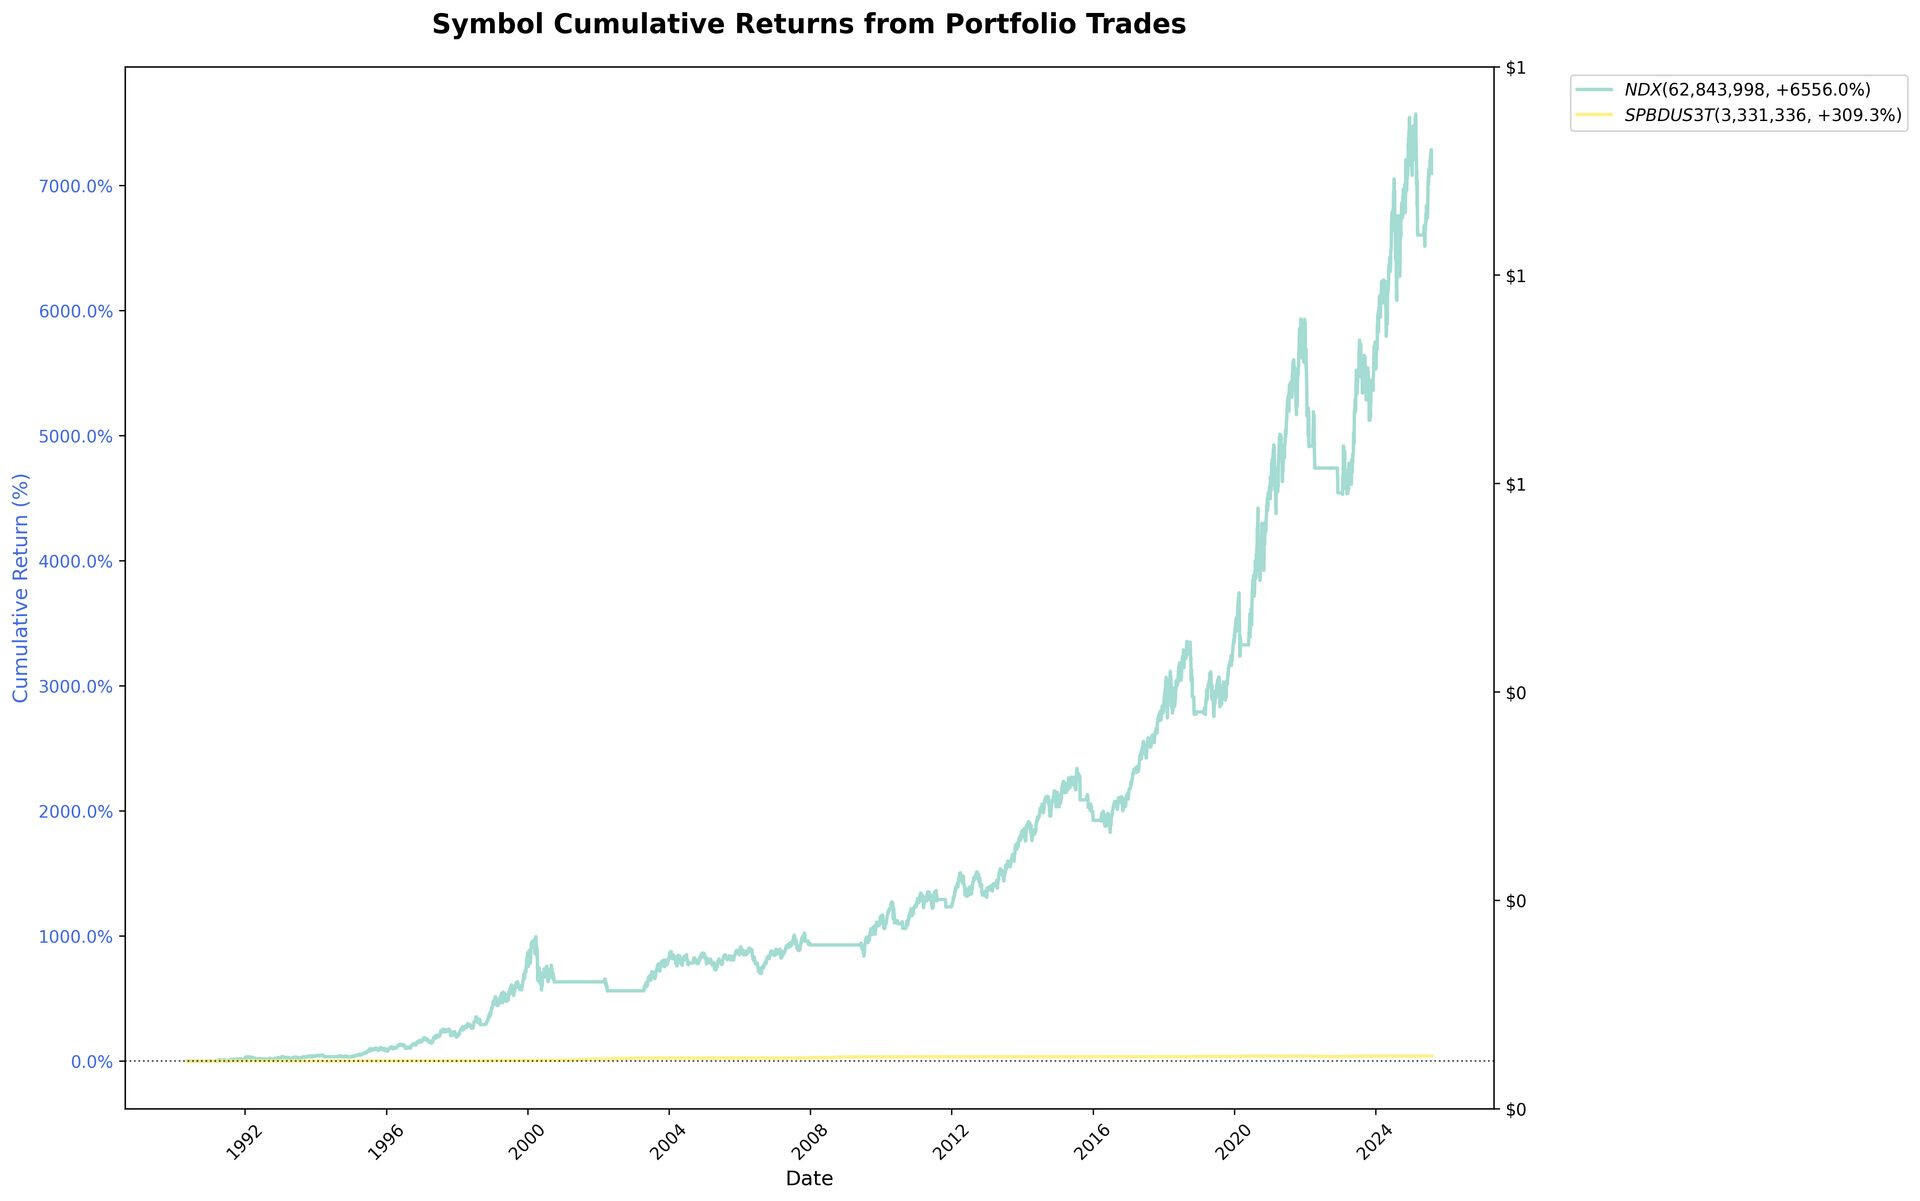
The strategy is a simple regime-shifting strategy. It works like this. When the S&P 500 is above its 200-day moving average, you put the entire portfolio in the Nasdaq 100. When the S&P 500 trades below its 200-day moving average, you put your money in US Treasury 1-3 year bonds. I have used the total return index for the bonds. I would use the total return of the Nasdaq 100, but I only have data back to 2000. I felt the longer price-only index was worth the tradeoff, so we go back to 1990.
As you can see from the contribution each symbol made towards the portfolio, it is mostly coming from the risk-on Nasdaq investment. The key point is that most of the outperformance is coming from the smaller drawdowns during the major drawdowns when the strategy is invested in Treasury bonds. During the dot-com sell-off, it actually performed worse at first but then outperformed; see the green in the drawdown chart above. During the subprime crisis it proved very defensive; see the green around 2008.
So what are my concerns? I am concerned as to whether the strategy has hindsight bias. Would we have known back in 1990 that we wanted to be long the Nasdaq 100 as our risk-on strategy for the next few decades? I am not so sure if we are being honest with ourselves. At best, maybe.
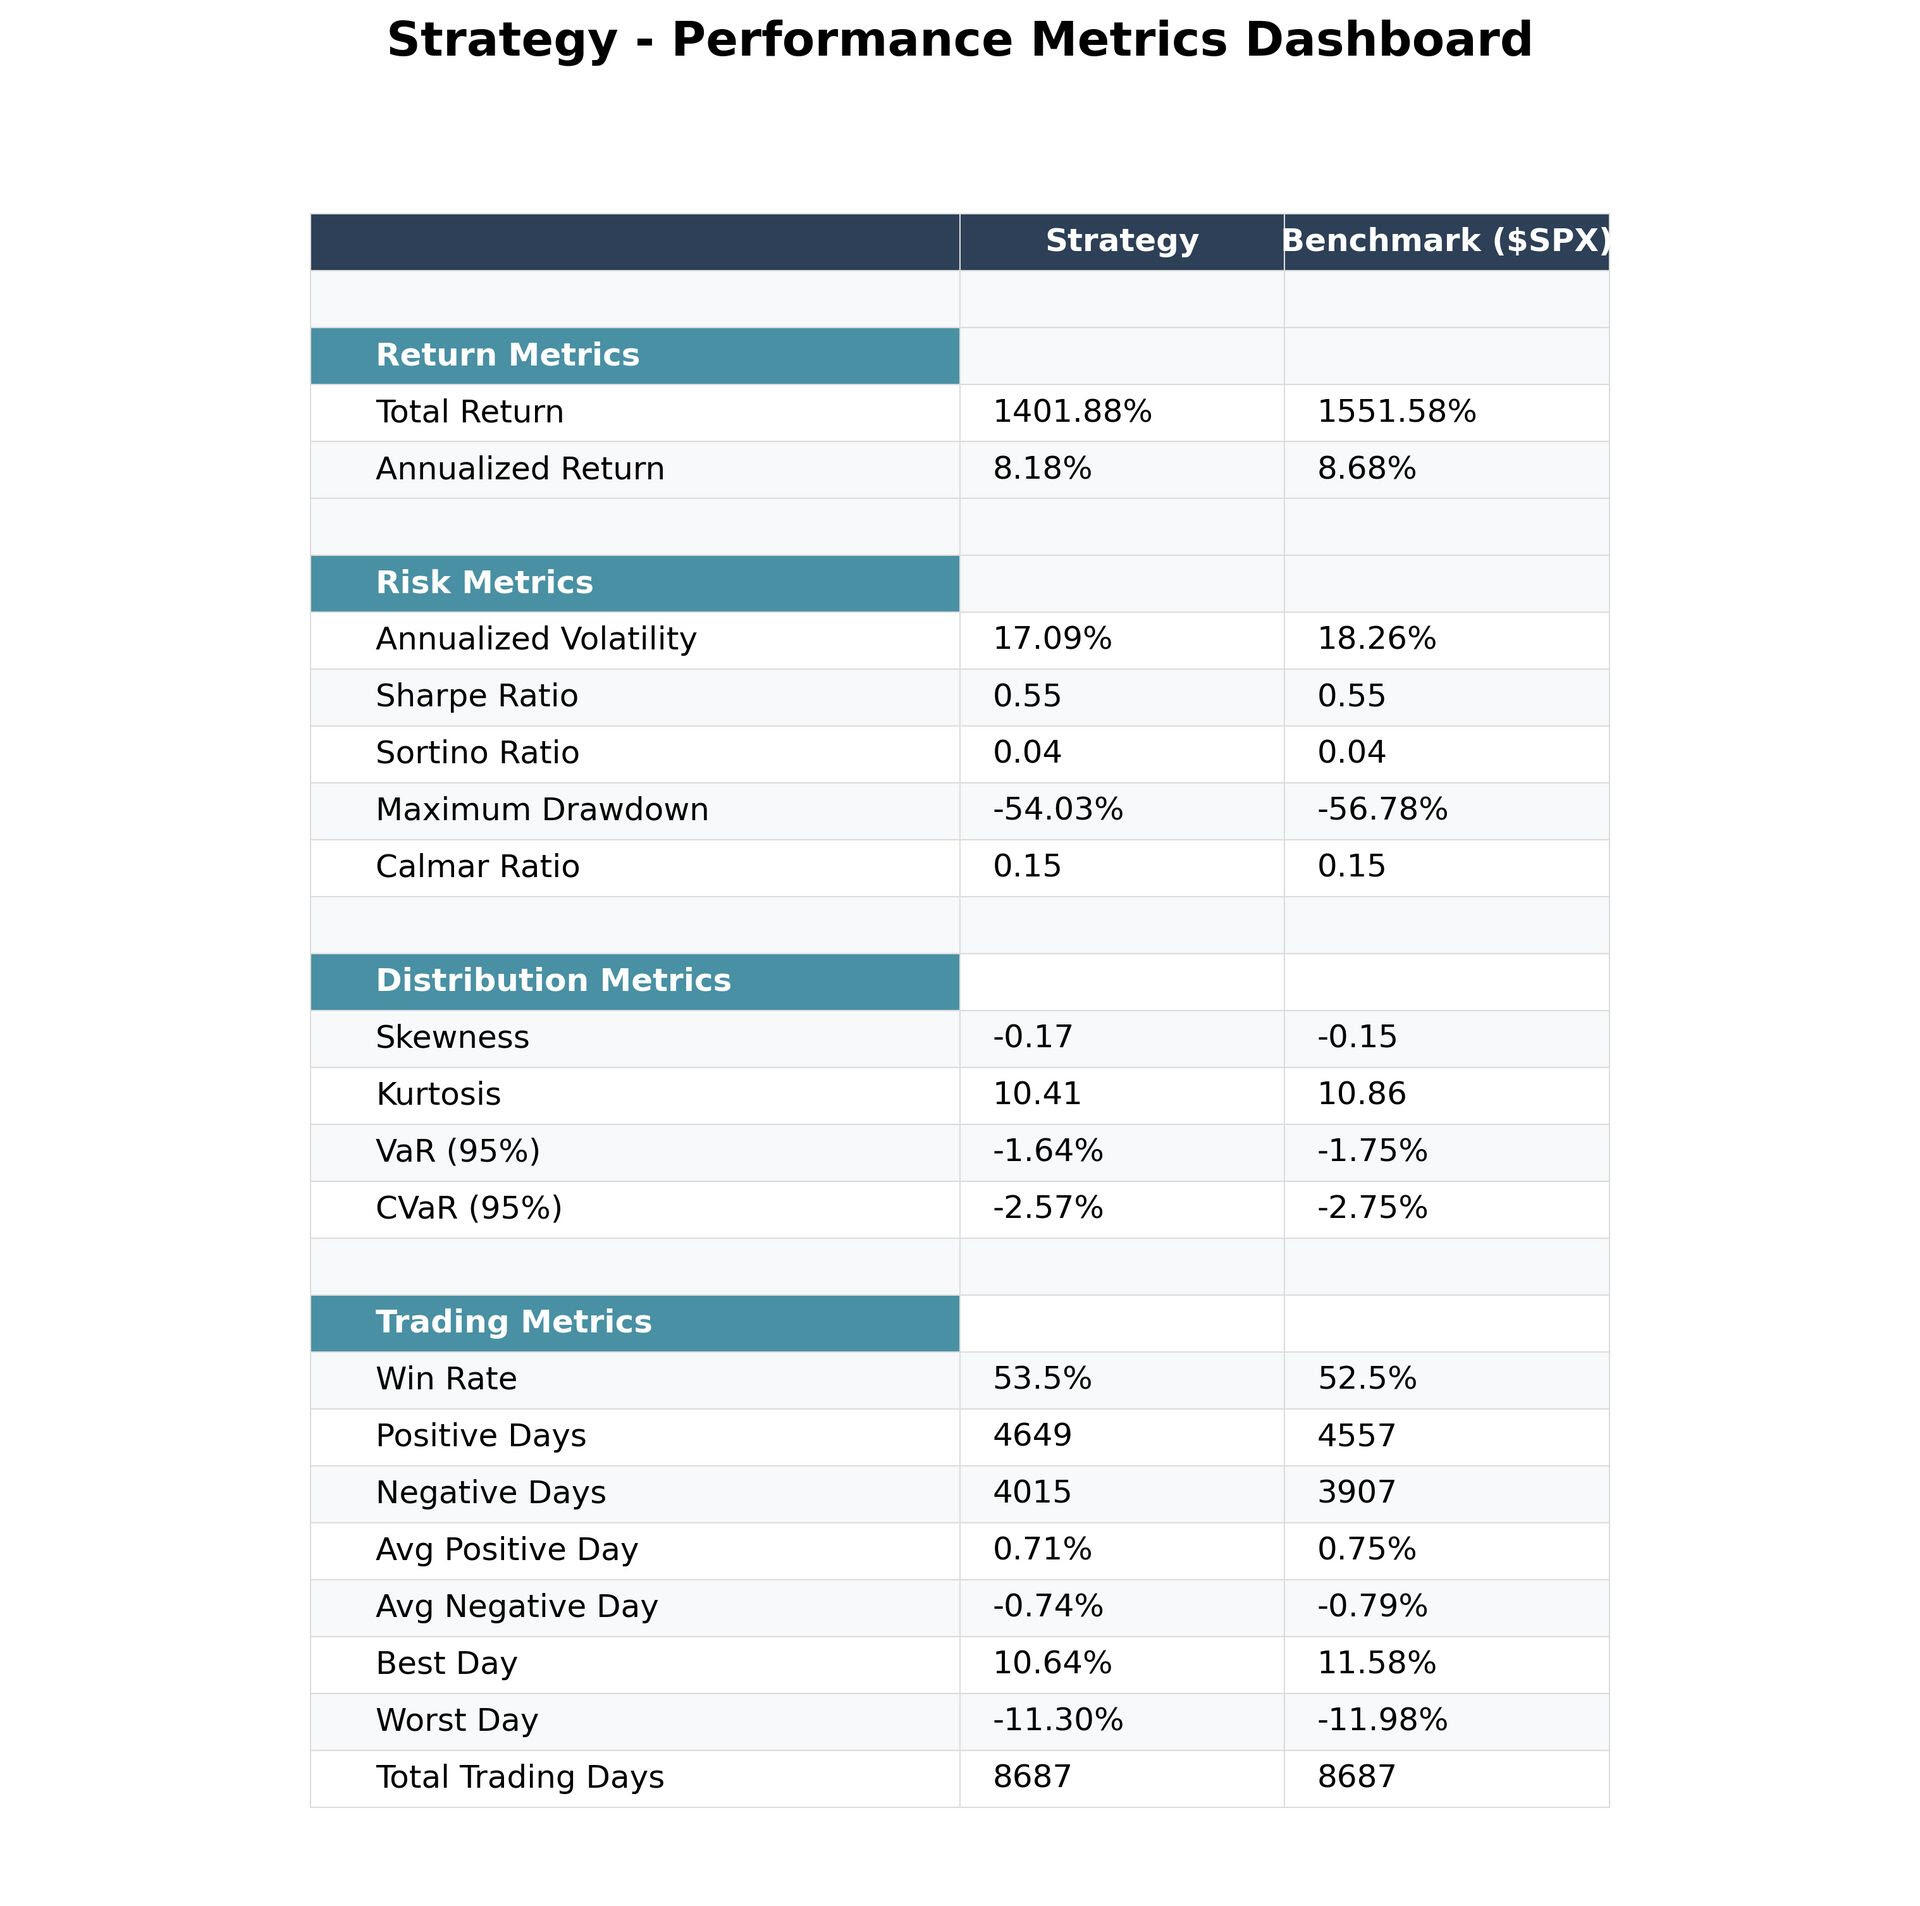
In the short time we have left today, I thought it would be appropriate to test how things would look if we used our benchmark, the S&P 500, as our risk-on asset to take away the potential hindsight bias and look at the quality of our regime shift indicator.
This is why I have been sitting on this for a week. You can see here that the benchmark outperforms the strategy, so the regime-shift indicator fails. My conclusion is that the fancy regime-shifting strategy is more of a beta bet. There is more to explore here. I am simply highlighting how it is easy to think you have discovered gold and then it turns out to be copper.
S2N observations
I won’t add anything to the current noise around the jobs data. However, I will say that, wearing my Jungian analyst hat, the behaviour of firing the messenger for delivering bad news was fascinating to the extreme.
I was sharing with a friend that I feel like such a fool. I read the first half of the book Chip Wars around 2 years ago. Great book, by the way. I loved the history and the science and engineering of the semiconductor industry. I then got bored and left it. I decided to read the other half last Wednesday. It seemed so obvious that the demand for GPUs was the next frontier. I wonder if I would have seen it if I had finished the book 2 years ago when I started it? Maybe I'm once again channelling some hindsight bias.
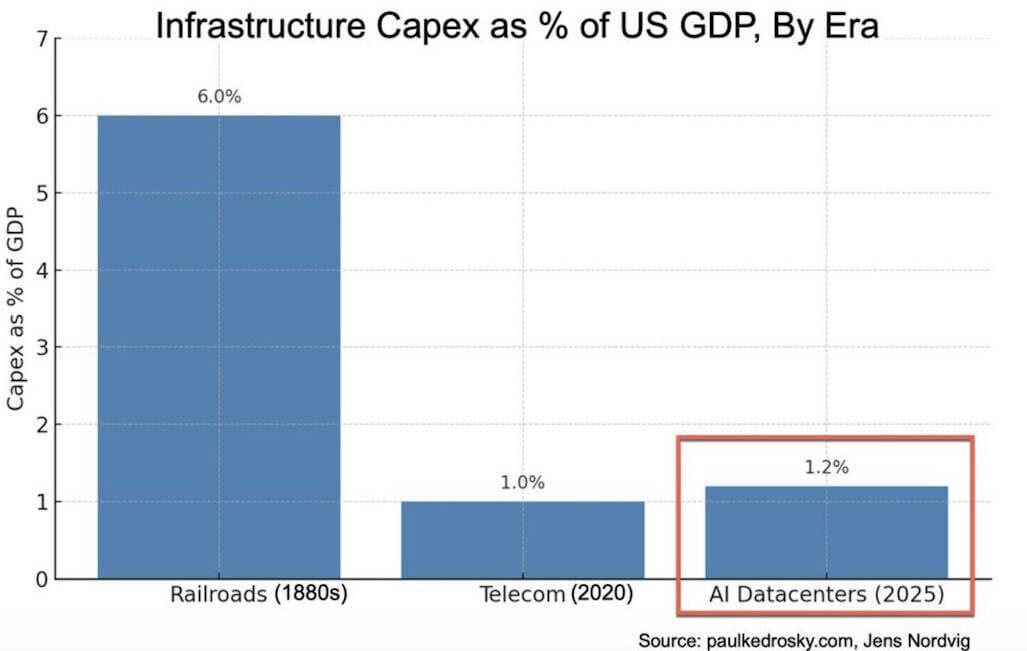
Yesterday I came across this infographic; it highlights how big the data centre and the AI infrastructure business are. This new frontier may give you a bit more comfort with the valuations of NVIDIA and a chosen few.
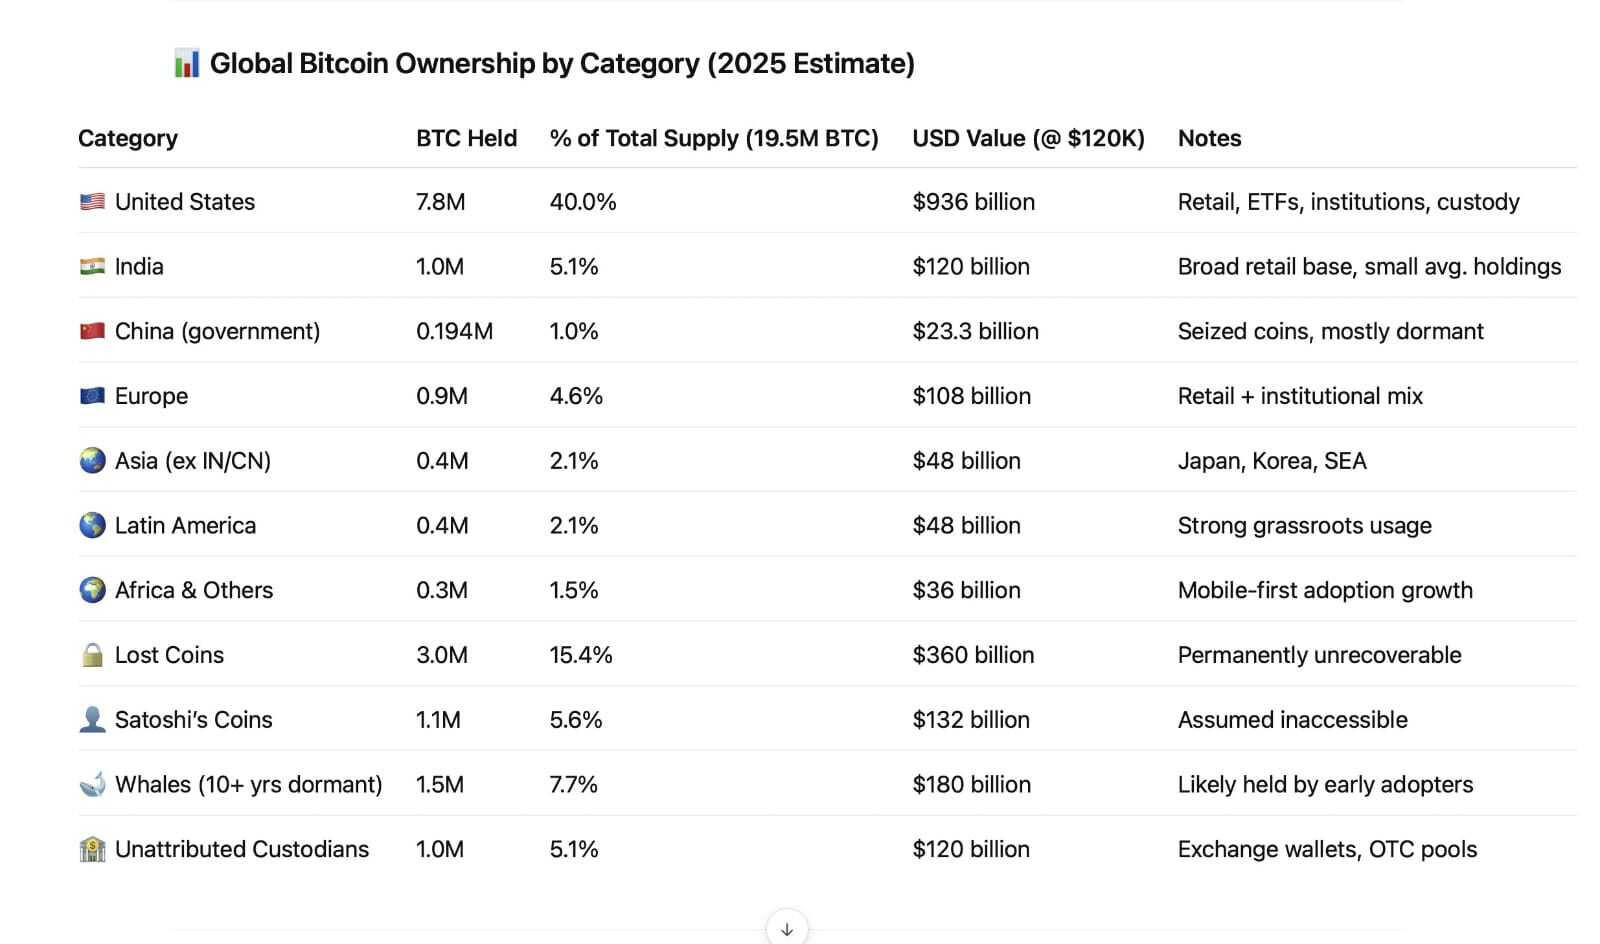
This is pretty interesting. I kind of guessed the US but had no idea how into Bitcoin India is.
I have debated with myself if I should share a new conspiracy theory doing the rounds. Hell, why not?
One of MicroStrategy’s directors, Carl Rickertsen, has just sold every last share of Strategy. So here it is. Michael Saylor has refused to publish on-chain proof of the company’s Bitcoin reserves. I feel a bit embarrassed sharing this; however, it is not inconceivable to think that all may not be kosher. It's kind of like, is the amount of gold in Fort Knox what they say it is?
S2N screener alert
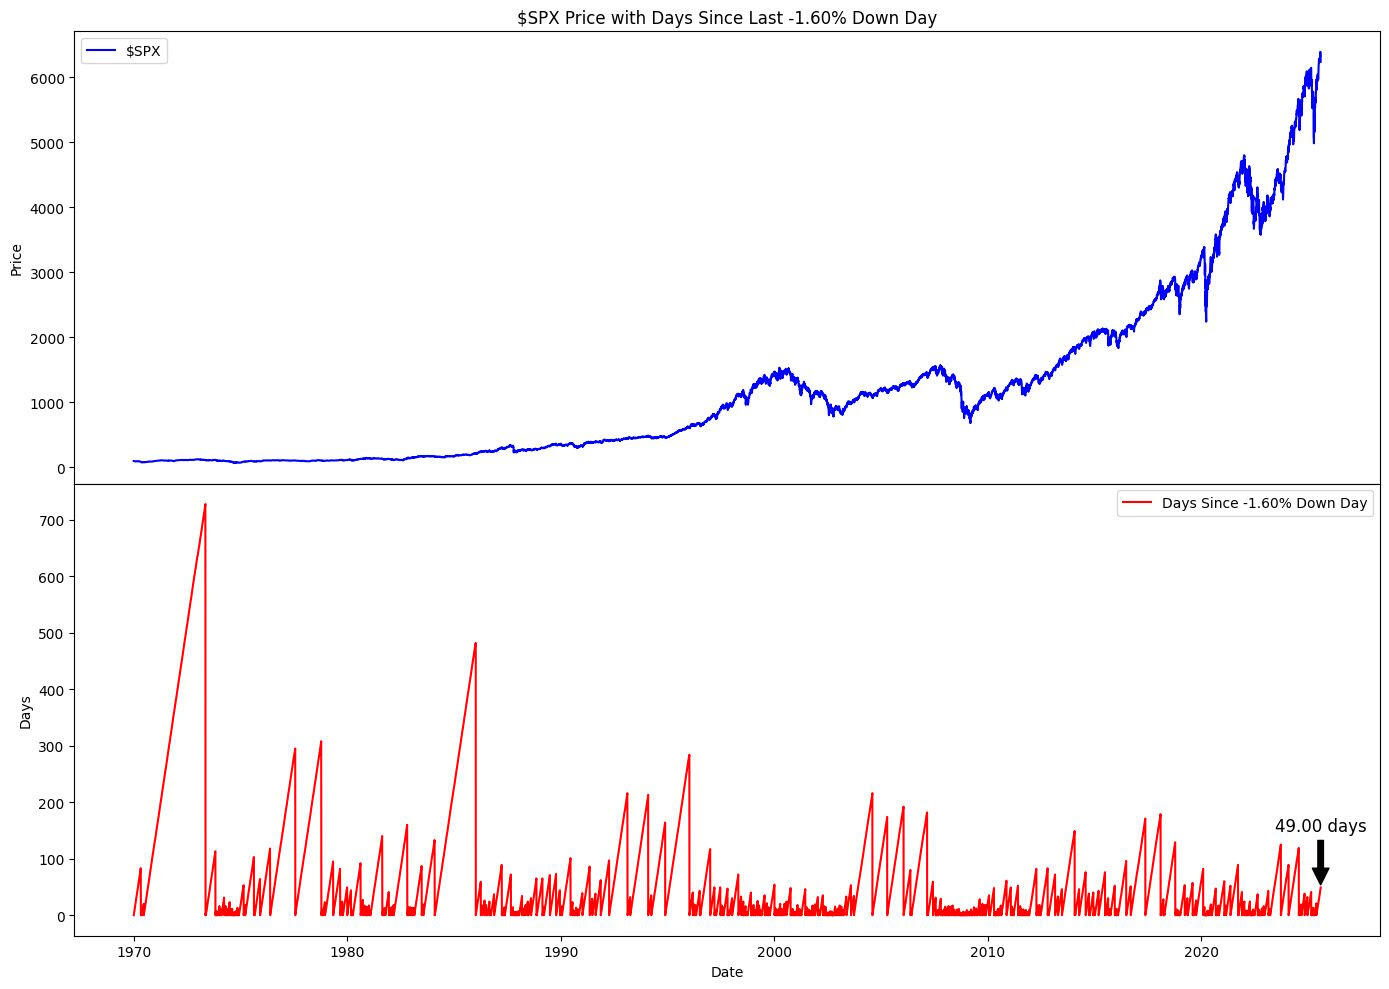
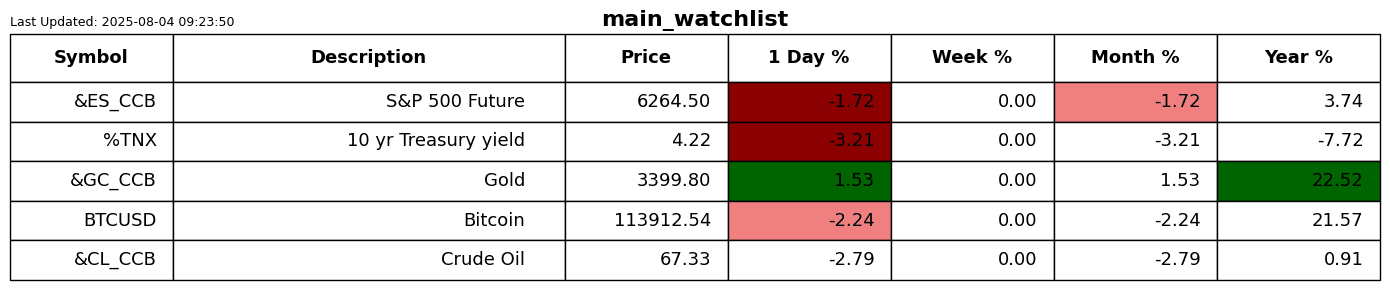
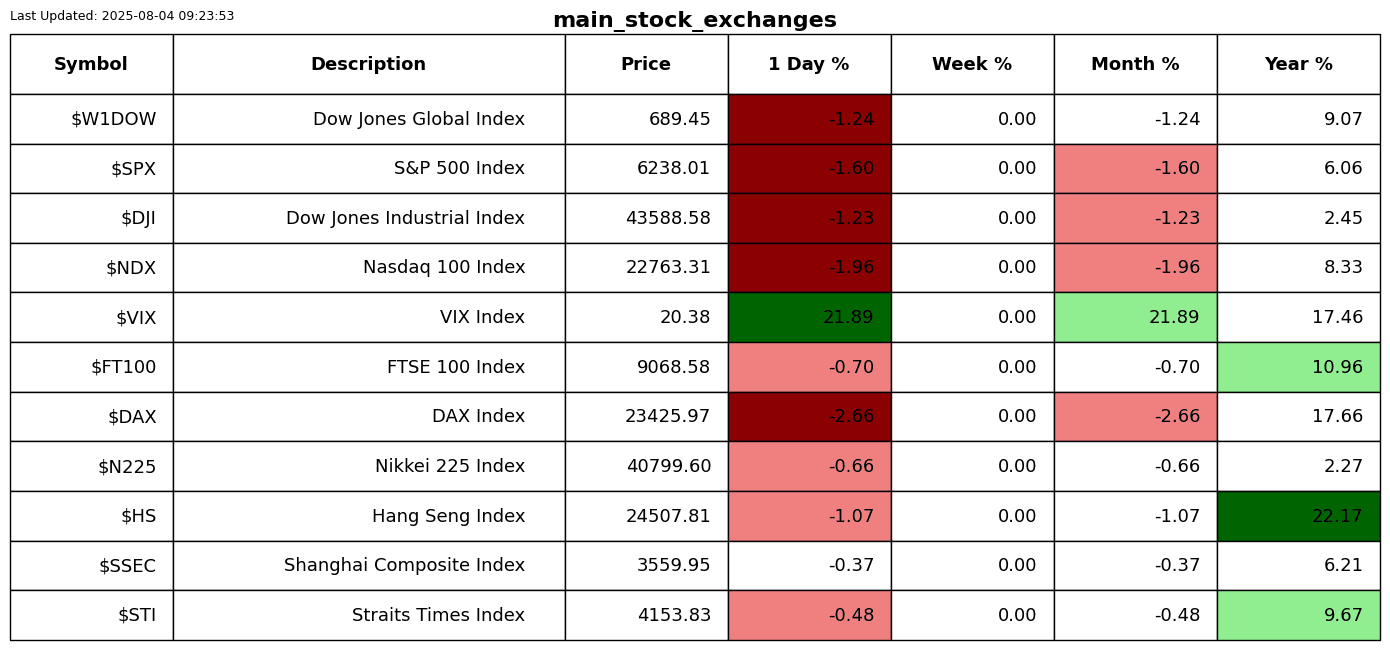
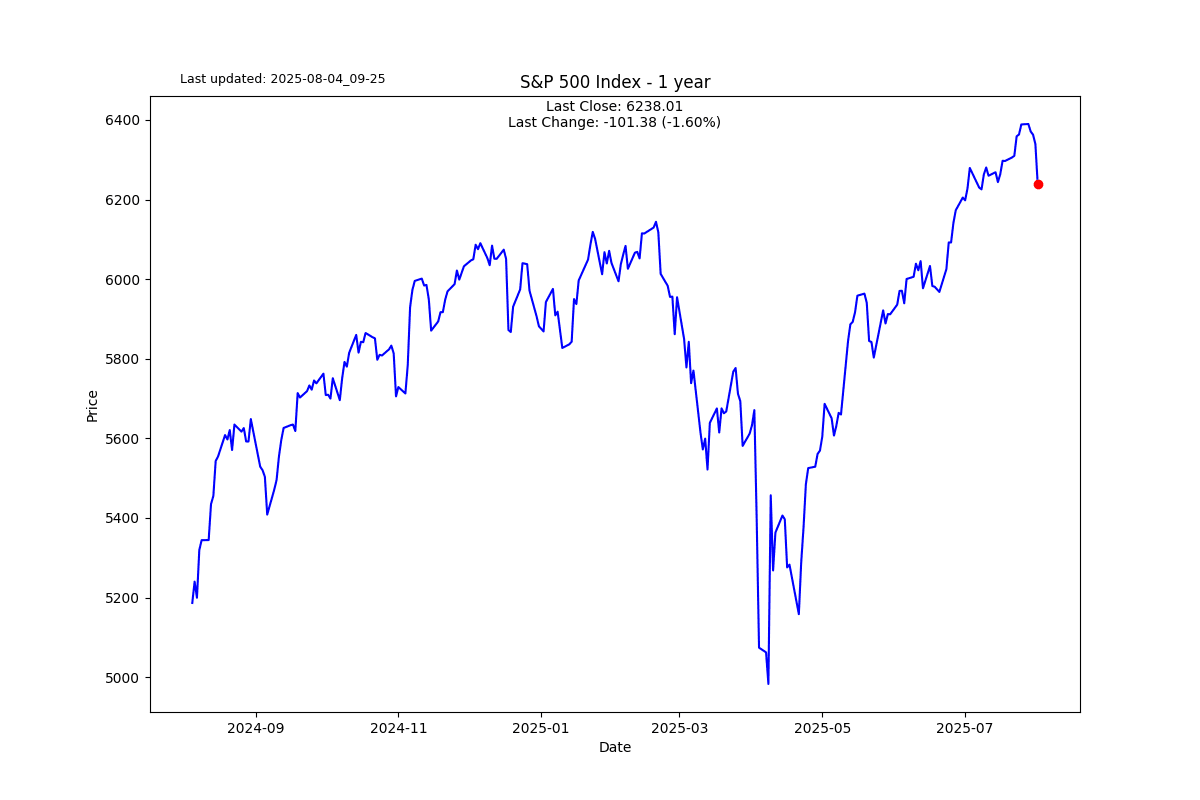
The markets have been so boring. It has been 49 days since we had a -1.60% day on the S&P 500.
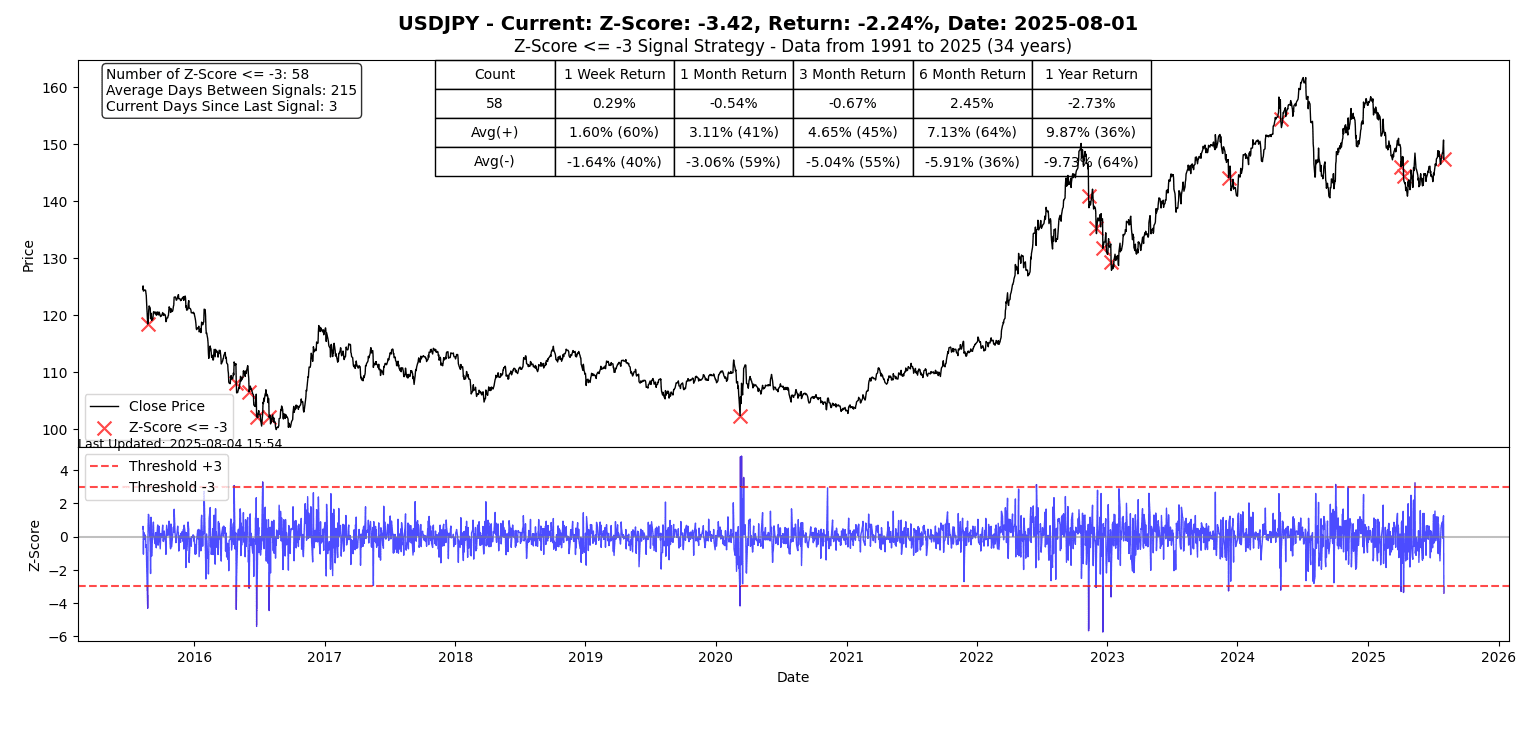
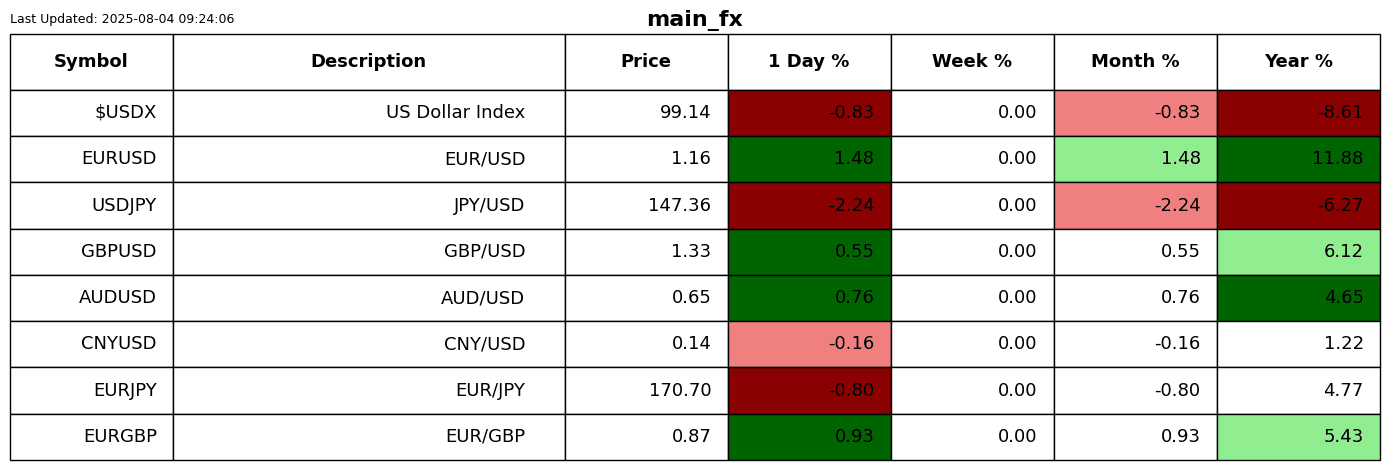
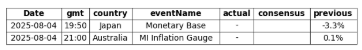
The Japanese Yen was the standout on Friday according to its Z-Score.
S2N performance review
S2N chart gallery
S2N news today
Author

Michael Berman, PhD
Signal2Noise (S2N) News
Michael has decades of experience as a professional trader, hedge fund manager and incubator of emerging traders.


