3 analysts' Gold views before US CPI: Two see a monetary shift underway, one says the rally is still capped

Gold (XAU/USD) is bouncing toward $4,200 ahead of next week's US Consumer Price Index (CPI) print, and the three latest FXStreet analyses read the same recovery in two completely different ways. Two argue something structural is happening underneath the price action - central banks quietly repricing Gold against the US Dollar (USD) and Exchange Traded Funds (ETFs) investors buying the dip at record scale - while the technical read warns the rebound is still corrective inside a larger downtrend.
Samuel Briggs (Kinesis Money): Not a rally - a repricing of global debt
The boldest framing comes from analyst Samuel Briggs, who argues current central bank behavior marks "something far bigger than a market rally" - the opening chapter of a restructuring of the monetary order. In this week's Live from the Vault, he details how central banks are swapping US Dollars for physical Gold at an unrivalled pace, and how gold has overtaken US Treasuries as the world's top reserve asset. His thesis: with the Fed the last major institution still carrying Gold on its books at $42 an ounce, sovereign balance sheets are being revalued in real time - and the current dip is being absorbed by the same buyers driving the gold rush. - Watch the full video
Mike Maharrey (Money Metals Exchange): Record ETF flows despite rising yields
The demand data backs the structural camp. "Despite tremendous price pressure on gold from rising yields, more metal flowed into gold-backed ETFs last month, driving fund holdings to a new record," Maharrey wrote. World Gold Council data show global holdings rose 67.3 tonnes to a record 4,256 tonnes in September, with Q3 inflows totaling 211 tonnes worth a record $31 billion - even as the Fed hiked rates 25 basis points and pushed Treasury yields higher. "This first quarterly inflow of 2026 marked a sharp reversal from the weakness seen earlier in the year, bringing y-t-d flows firmly into positive territory at $4.1billion," the World Gold Council noted. Buying was broad: North American funds added 27.7 tonnes, UK funds logged their most consistent run since 2022, and Chinese funds kept buying into weakness. - Read the full report
Dhwani Mehta (FXStreet): The chart is still capped
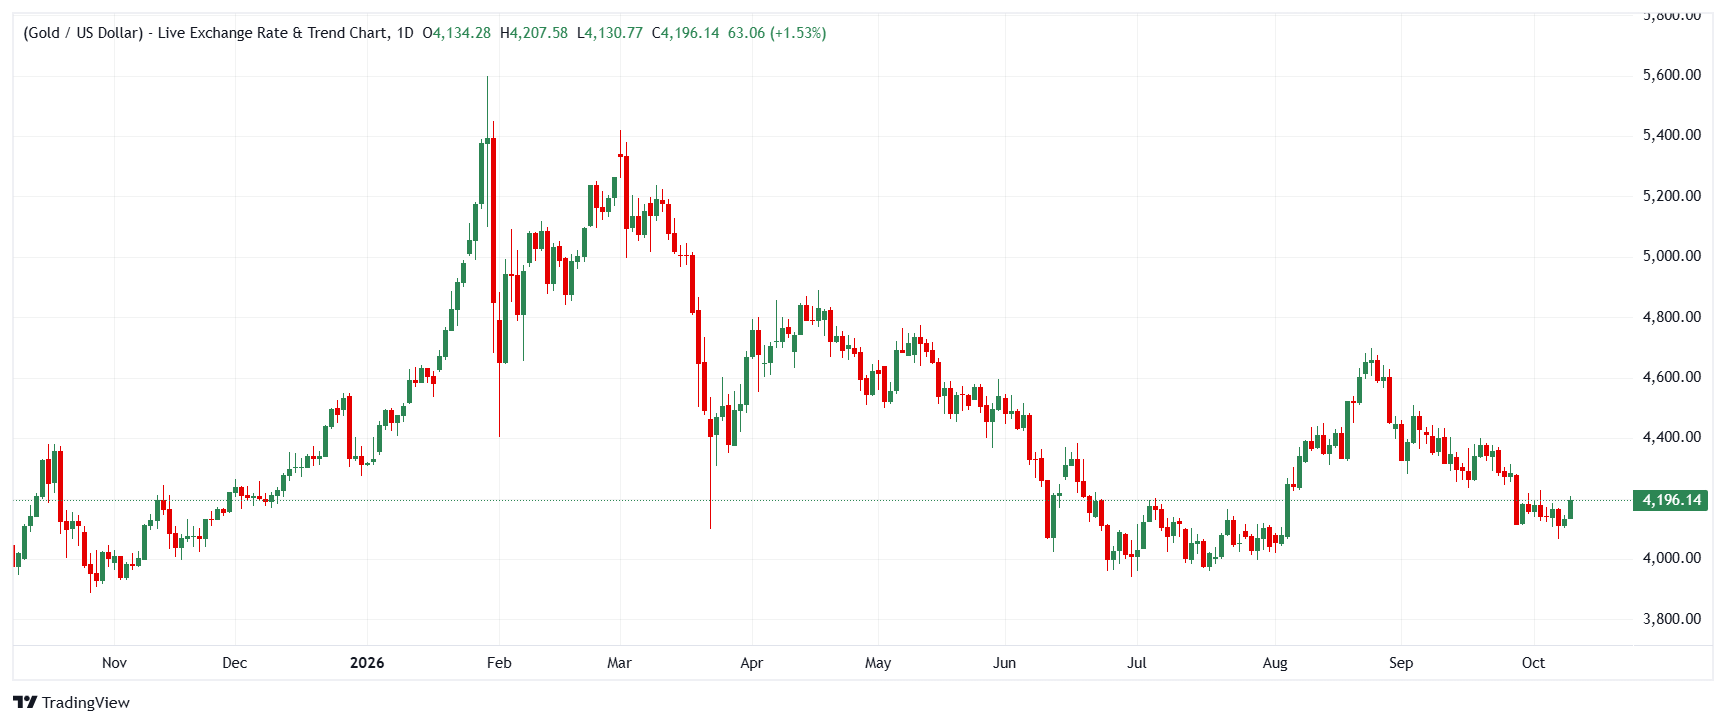
The technician is not convinced. Gold is extending recovery from the two-month low of $4,067, aiming for $4,200 "amid a continued retreat in the US Dollar (USD) from 18-month highs," but the daily chart "maintains a bearish near-term bias as spot holds beneath the key moving averages" - the 100-day SMA at $4,259.87, the 50-day SMA at $4,334.80 and the 200-day SMA at $4,529.19 all sit overhead, while the RSI around 44 "leans slightly negative." Mehta flags the rising trend-line support near $4,001 as the line that keeps a recovery alive, with next week's CPI deciding whether a Fed hike this month - and another in December - stays on the table. - Read the full report
The takeaway
This is a split by timeframe, not direction: the structural camp sees a repricing already underway - record ETF holdings, central bank accumulation, Gold above Treasuries in reserves - while the technical read says every rally remains corrective until the 100-day SMA at $4,259 breaks. Watch next week's US CPI: it decides whether a December Fed hike stays on the table, and whether this bounce turns into something more.
(This article was created with the help of an Artificial Intelligence tool and reviewed by an editor. Know more.)
Author

FXStreet Insights Team
FXStreet
The FXStreet Insights Team is a group of journalists that handpicks selected market observations published by renowned experts. The content includes notes by commercial as well as additional insights by internal and external analysts.

















