Wyckoff method reveals the next bull run in this sector [Video]
![Wyckoff method reveals the next bull run in this sector [Video]](https://editorial.fxstreet.com/images/TechnicalAnalysis/ChartPatterns/Candlesticks/close-up-of-candlestick-stock-chart-with-pen-40815814.jpg)
Here is how you can take advantage of the potential next bull run in the China stocks upon completion of the market bottom via Wyckoff accumulation.
Pay attention to how to adopt the Wyckoff method to spot the 3 tell-tale signs of the accumulation structures.
The bullish setup vs. bearish setup is 24 vs 80 from the screenshot of my stock screener below. The bearish setup has decreased from 838 to 80, which is a change of the market environment last week.
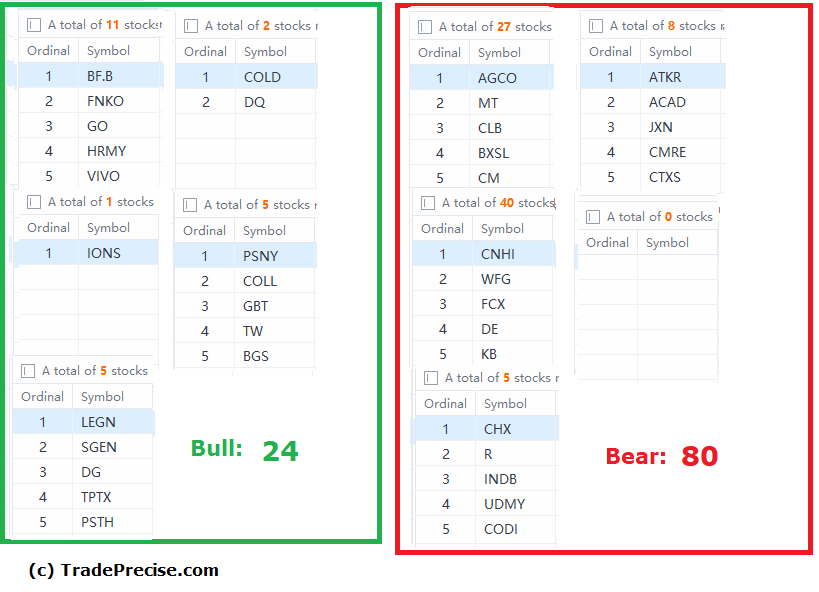
However the bullish setup is very limited because there is no more leadership in the market after the energy sector was shot down 2 weeks ago. It is essential to be selective and trade the outperforming stocks in order to ride the sustainable trend.
Author

Ming Jong Tey
Independent Analyst
Ming Jong Tey has been trading since 2008. He started his learning journey from technical analysis (indicators, Fibonacci, etc...) to value investing. Throughout his journey, he develops an interest in price action with chart pattern trading.


