WTI Oil falls near $80 as Iran fully reopens Strait of Hormuz, easing supply fears
- WTI US Oil prices tumble sharply after Iran announces that the Strait of Hormuz is fully reopened to commercial shipping during the ceasefire period.
- The move removes immediate fears of a major supply disruption that had previously pushed prices sharply higher.
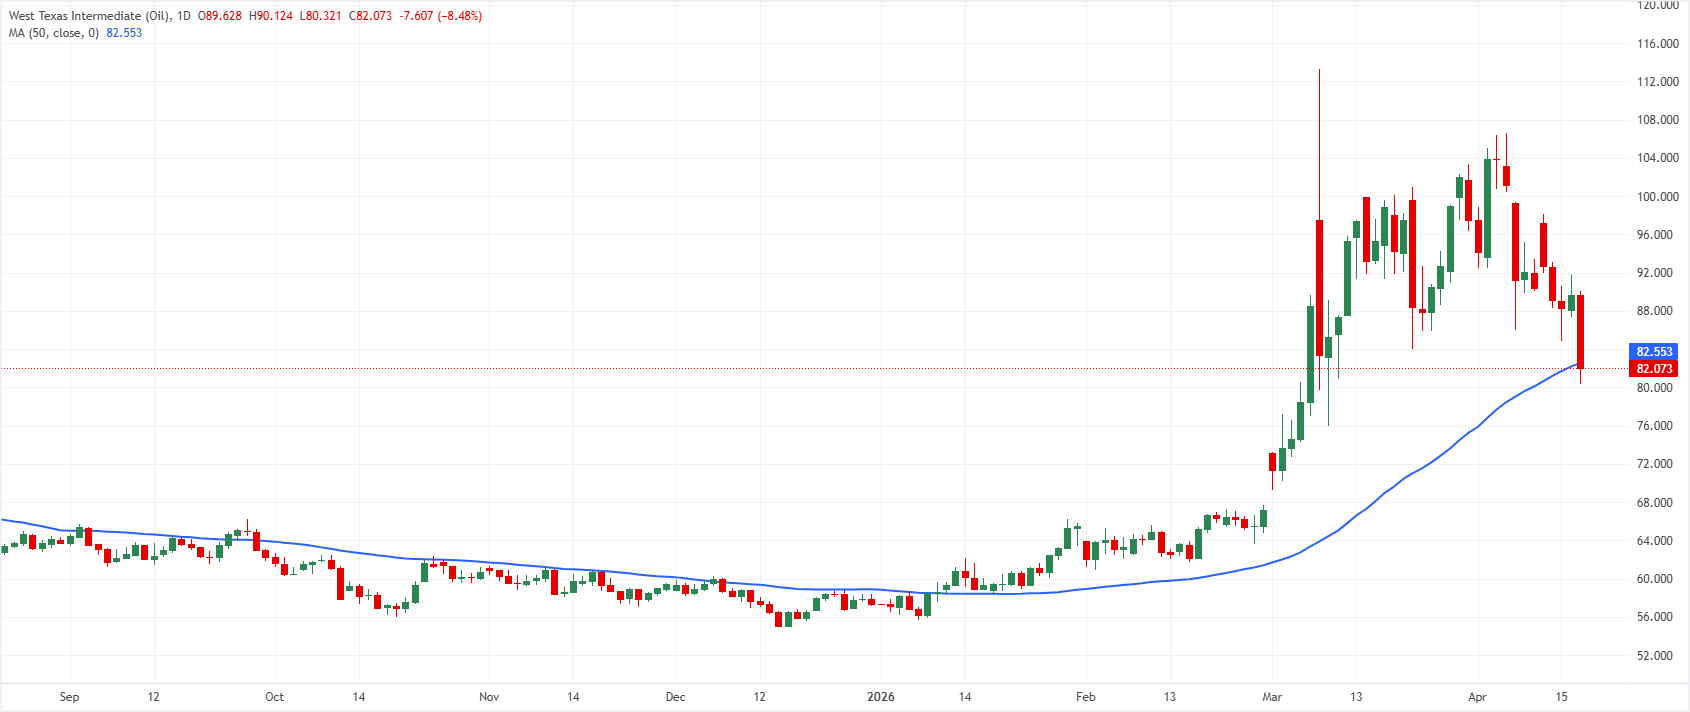
- WTI falls more than 9% on Friday, retreating from an intraday peak above $90 toward levels near $80.

West Texas Intermediate (WTI) US Oil price collapses on Friday, trading near $81.50 at the time of writing after losing 9.12% during the day. The move marks a sharp acceleration lower after the Crude briefly surged above $90 earlier in the day before sellers took control. WTI even touched an intraday low at $80.30, its weakest level since March 10, bringing the psychological $80 level back into focus for market participants.
The sudden sell-off follows a major geopolitical development in the Middle East. Iran’s Foreign Minister Abbas Araghchi announced that, following the ceasefire in Lebanon, the Strait of Hormuz has been declared completely open to all commercial vessels for the remainder of the truce period. According to Araghchi, maritime traffic through the strategic chokepoint will resume via coordinated routes already established by the Ports and Maritime Organisation of Iran.
United States (US) President Donald Trump responded to this development with a post on Truth Social. "The Strait of Hormuz is completely open and ready for business and full passage, but the naval blockade will remain in full force and effect as it pertains to Iran, only, until such time as our transaction with Iran is 100% complete," Trump said, and added that he expects this process to go very quickly since most of the points are already negotiated.
The announcement dramatically changes the market narrative that had previously fueled the sharp rally in Oil prices. In recent days, traders feared a prolonged closure of the Strait of Hormuz following escalating tensions between the US and Iran. The waterway is one of the world’s most critical energy corridors, handling a significant share of global Oil flows.
Earlier estimates from ING suggested that roughly 13 million barrels per day of Oil supply had been disrupted due to the blockade around the Strait, contributing to extreme volatility in the energy market. The reopening, therefore, signals a potential normalization of supply flows, prompting traders to rapidly unwind risk premiums embedded in prices.
As a result, the easing of geopolitical risk is triggering a swift repositioning in Oil markets. With supply concerns suddenly receding, attention is now turning to the durability of the ceasefire and whether Washington and Tehran can reach a more lasting agreement to keep the Strait of Hormuz open over time.
WTI Oil FAQs
WTI Oil is a type of Crude Oil sold on international markets. The WTI stands for West Texas Intermediate, one of three major types including Brent and Dubai Crude. WTI is also referred to as “light” and “sweet” because of its relatively low gravity and sulfur content respectively. It is considered a high quality Oil that is easily refined. It is sourced in the United States and distributed via the Cushing hub, which is considered “The Pipeline Crossroads of the World”. It is a benchmark for the Oil market and WTI price is frequently quoted in the media.
Like all assets, supply and demand are the key drivers of WTI Oil price. As such, global growth can be a driver of increased demand and vice versa for weak global growth. Political instability, wars, and sanctions can disrupt supply and impact prices. The decisions of OPEC, a group of major Oil-producing countries, is another key driver of price. The value of the US Dollar influences the price of WTI Crude Oil, since Oil is predominantly traded in US Dollars, thus a weaker US Dollar can make Oil more affordable and vice versa.
The weekly Oil inventory reports published by the American Petroleum Institute (API) and the Energy Information Agency (EIA) impact the price of WTI Oil. Changes in inventories reflect fluctuating supply and demand. If the data shows a drop in inventories it can indicate increased demand, pushing up Oil price. Higher inventories can reflect increased supply, pushing down prices. API’s report is published every Tuesday and EIA’s the day after. Their results are usually similar, falling within 1% of each other 75% of the time. The EIA data is considered more reliable, since it is a government agency.
OPEC (Organization of the Petroleum Exporting Countries) is a group of 12 Oil-producing nations who collectively decide production quotas for member countries at twice-yearly meetings. Their decisions often impact WTI Oil prices. When OPEC decides to lower quotas, it can tighten supply, pushing up Oil prices. When OPEC increases production, it has the opposite effect. OPEC+ refers to an expanded group that includes ten extra non-OPEC members, the most notable of which is Russia.
Author

Ghiles Guezout
FXStreet
Ghiles Guezout is a Market Analyst with a strong background in stock market investments, trading, and cryptocurrencies. He combines fundamental and technical analysis skills to identify market opportunities.

















