Will MercadoLibre (MELI) skyrocket to its previous all-time high with this rounding bottom pattern? [Video]
![Will MercadoLibre (MELI) skyrocket to its previous all-time high with this rounding bottom pattern? [Video]](https://editorial.fxstreet.com/images/Markets/Equities/Industries/CommercialServices/pic-business-agreement.jpg)
MercadoLibre, Inc (MELI) is the top e-commerce platform in Latin America, providing six integrated services to businesses and individuals. The Marketplace allows for online sales and merchandise listings, while Classifieds offers online classified listings for vehicles, real estate, and services. The MercadoPago FinTech platform facilitates seamless payments within the marketplace, as well as via websites and mobile apps. Advertising services and MercadoShops help sellers promote and manage their online stores. The Argentine company operates across 15 countries in the region, including Brazil, Mexico, and Uruguay. MELI is listed on NASDAQ and is a component of Nasdaq 100.
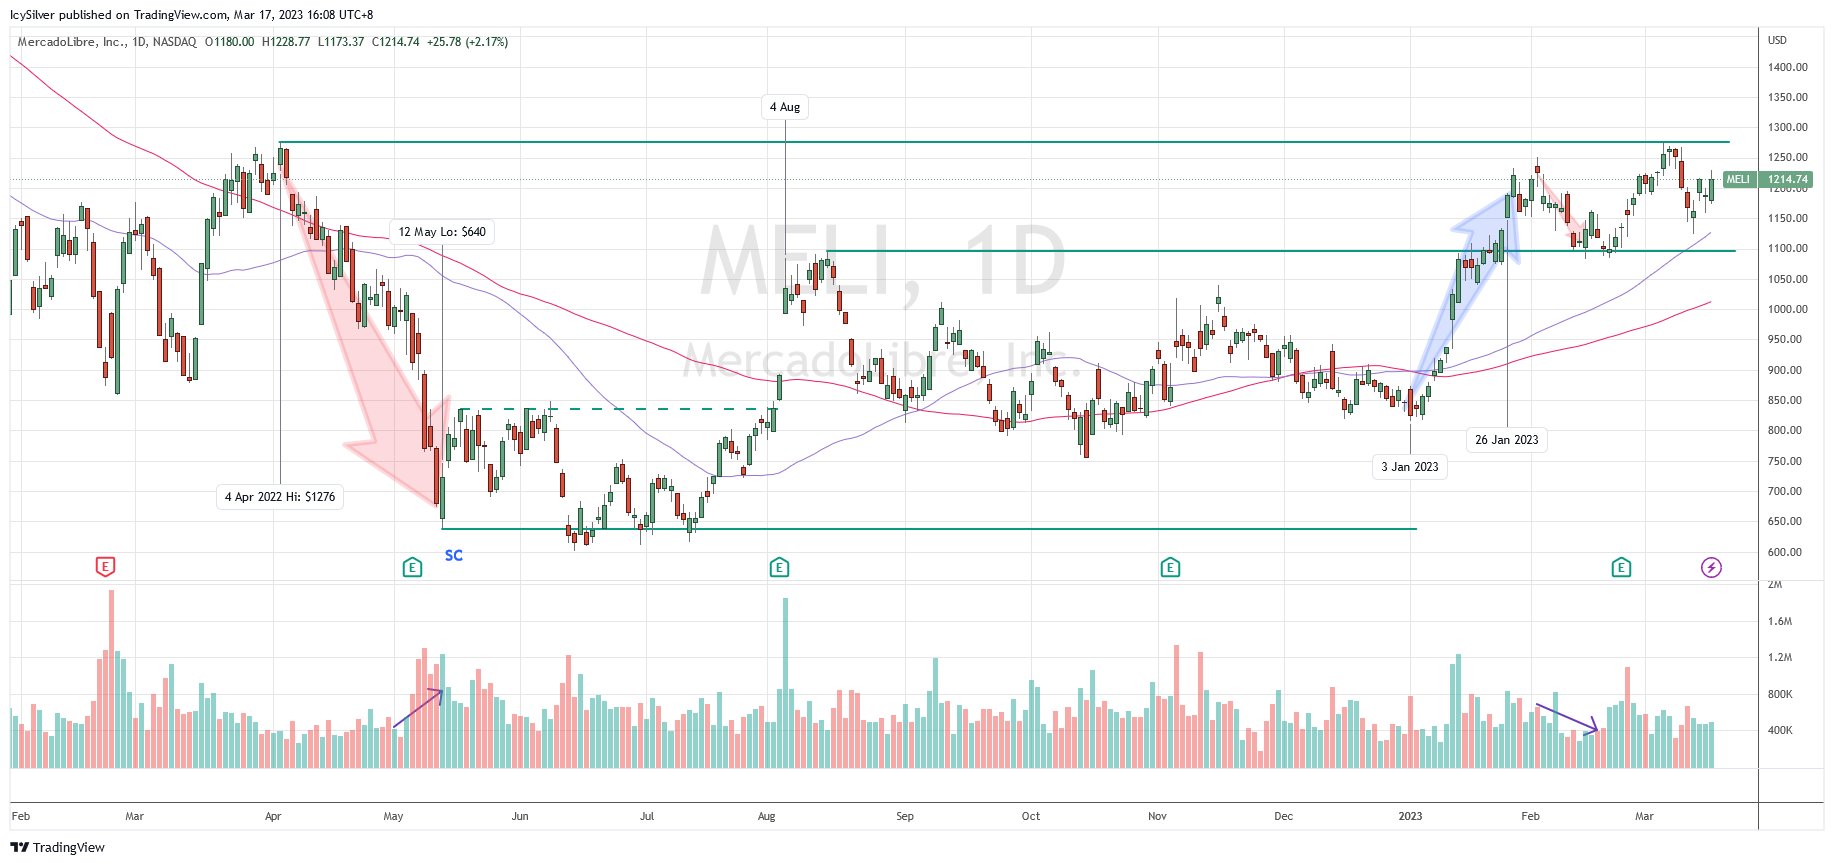
Wyckoff distribution evolved to Wyckoff accumulation
Since September 2021, MELI has been in a vulnerable position as the Wyckoff distribution pattern for S&P 500 was unfolding. There was a rally to around $1276 on 4 Apr 2022 but the price retraced with Wyckoff sign of weakness (SOW). It continued all the way to $640 until 12 May where a Wyckoff selling climax (SC) formed. This was accompanied by an increase in volume suggesting the presence of supply.
The price subsequently was consolidating between $640 and $835 for several weeks. The price gap up on 4 Aug with earning results as catalyst but there was no follow through to the up side. Nevertheless, MELI did not retrace to test the low of the trading range suggesting formation of a Wyckoff accumulation phase that lasted around 8 months.
A Wyckoff sign of strength (SOS) rally started on 3 Jan 2023 brought the price to break above the $1100 axis line. It was the best rally so far. Although the price retraced and tested the axis of $1100, it was able to stay committed above it. There was also no threatening supply volume during the test phase in early to mid Feb. MELI continued on to rally and challenged the resistance at $1276 but was unsuccessful at breaking out.
Bias
Bullish. According to the Wyckoff method, MELI is consolidating in the Wyckoff back up (BU) phase between $1100 and $1276. It is worth noting that the pullback since February 2023 is the shallowest, suggesting a structural strength. The price will likely challenge the resistance again. If it is successful at breaking out from the BU phase, the price could reach $1360 as an immediate target. This will complete the bullish rounding bottom pattern since April 2022.
If the price breaks below $1100, it will likely retest the swing low of $1040 followed by $950 with a prolonged consolidation in the trading range.
MELI was discussed in detail in my weekly live group coaching on 28 Feb 2023 before the market opened. Despite the sharp market correction due to the two forces as discussed in the video from last week (refer below), MELI, together with the mega cap growth stocks exhibited strong relative strength.
Author

Ming Jong Tey
Independent Analyst
Ming Jong Tey has been trading since 2008. He started his learning journey from technical analysis (indicators, Fibonacci, etc...) to value investing. Throughout his journey, he develops an interest in price action with chart pattern trading.