Breaking: Eurozone flash headline HICP rises moderately by 2.5% YoY vs. 2.7% estimates

Annual Harmonized Index of Consumer Prices (HICP) in the Eurozone, as measured by changes in the prices of a representative basket of goods and services in the European Monetary Union, rises at a moderate pace of 2.5% in March, against estimates of 2.7%. In February, the data grew by 1.9%. On a monthly basis, headline inflation arrives significantly higher at 1.2% from 0.6% in February.
Eurozone's annual core HICP – which excludes volatile components like food, energy, alcohol, and tobacco – rises at a moderate pace of 2.3%, compared to the estimates and the former release of 2.4%. Month-on-month core HICP grew steadily by 0.8%.
Market reaction
The immediate reaction of the Euro (EUR) after the inflation data release was slightly negative. However, EUR/USD trades marginally higher around 1.1465 as of writing.
(This section below was published at 07:30 GMT as a preview of the Eurozone preliminary HICP data for March)
Eurozone flash HICP data preview
The Eurozone preliminary Harmonized Index of Consumer Prices (HICP) data for March is scheduled to be published today at 09:00 GMT.
According to preliminary estimates, the Eurostat will show that the headline HICP grew at a robust pace of 2.7% Year-on-Year (YoY) against 1.9% in February. Higher Eurozone inflation expectations are backed by surging oil prices due to the ongoing war in the Middle East.
Eurozone’s core HICP – which excludes volatile components like food, energy, alcohol, and tobacco – is estimated to have remained steady at 2.4% YoY.
Signs of higher inflationary pressures would prompt expectations that the European Central Bank (ECB) will turn hawkish in upcoming monetary policy meetings.
ECB President Christine Lagarde said in her speech at the ECB and its Watchers conference at Goethe University in Frankfurt last week that “the case for action becomes stronger when deviations from our inflation target grow larger and more persistent”. Lagarde added, “If the shock gives rise to a large though not-too-persistent overshoot of our target, some measured adjustment of policy could be warranted.”
Meanwhile, Middle East tensions have eased as United States (US) President Donald Trump has expressed readiness to end the war in Iran, according to a report from the Wall Street Journal (WSJ); however, oil prices are expected to remain firm as Trump is willing for peace despite the Strait of Hormuz, a passage through which almost 20% of global energy is shipped, remaining closed.
How could Eurozone flash HICP data affect EUR/USD?
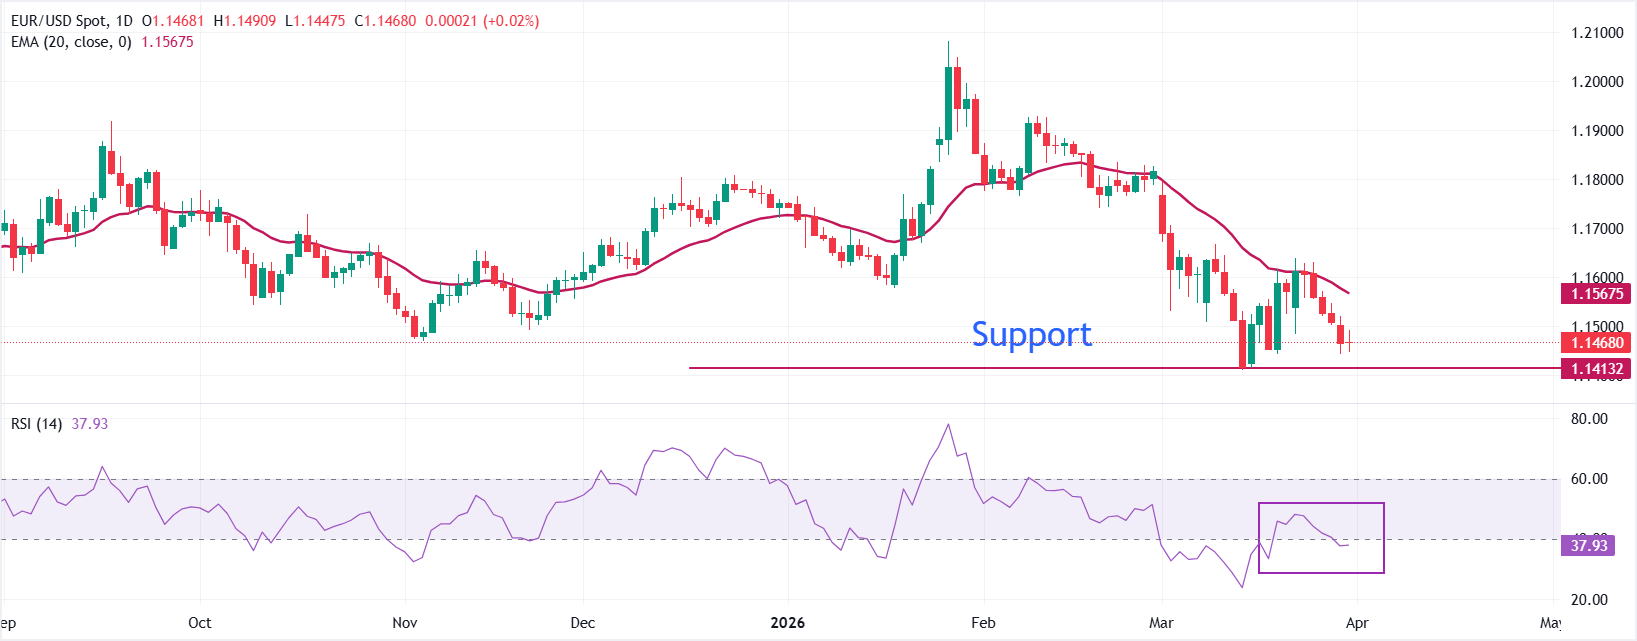
EUR/USD trades slightly higher at around 1.1468 as of writing. The near-term bias stays bearish, as spot continues to print lower highs and lower lows beneath the descending 20-day Exponential Moving Average (EMA), which now caps around 1.1570. The recent failure to sustain rebounds toward the 20-day EMA underscores persistent selling pressure, while RSI falling back below 40.00 signals the onset of weak momentum. As long as price holds under the 20-day average, rallies look corrective within a broader downside phase.
Initial resistance emerges at the 20-day EMA around 1.1570, followed by the March 23 high of around 1.1640. A daily close above the latter would weaken the bearish tone and open the way toward 1.1690. On the downside, immediate support aligns around 1.1460, just below the current market, with a break exposing 1.1415 as the next bearish target. Below 1.1415, the pair would risk accelerating toward the 1.1350 region.
(The technical analysis of this story was written with the help of an AI tool.)
Inflation FAQs
Inflation measures the rise in the price of a representative basket of goods and services. Headline inflation is usually expressed as a percentage change on a month-on-month (MoM) and year-on-year (YoY) basis. Core inflation excludes more volatile elements such as food and fuel which can fluctuate because of geopolitical and seasonal factors. Core inflation is the figure economists focus on and is the level targeted by central banks, which are mandated to keep inflation at a manageable level, usually around 2%.
The Consumer Price Index (CPI) measures the change in prices of a basket of goods and services over a period of time. It is usually expressed as a percentage change on a month-on-month (MoM) and year-on-year (YoY) basis. Core CPI is the figure targeted by central banks as it excludes volatile food and fuel inputs. When Core CPI rises above 2% it usually results in higher interest rates and vice versa when it falls below 2%. Since higher interest rates are positive for a currency, higher inflation usually results in a stronger currency. The opposite is true when inflation falls.
Although it may seem counter-intuitive, high inflation in a country pushes up the value of its currency and vice versa for lower inflation. This is because the central bank will normally raise interest rates to combat the higher inflation, which attract more global capital inflows from investors looking for a lucrative place to park their money.
Formerly, Gold was the asset investors turned to in times of high inflation because it preserved its value, and whilst investors will often still buy Gold for its safe-haven properties in times of extreme market turmoil, this is not the case most of the time. This is because when inflation is high, central banks will put up interest rates to combat it. Higher interest rates are negative for Gold because they increase the opportunity-cost of holding Gold vis-a-vis an interest-bearing asset or placing the money in a cash deposit account. On the flipside, lower inflation tends to be positive for Gold as it brings interest rates down, making the bright metal a more viable investment alternative.
Author

Sagar Dua
FXStreet
Sagar Dua is associated with the financial markets from his college days. Along with pursuing post-graduation in Commerce in 2014, he started his markets training with chart analysis.
















