USO nests after blue box bounce, targets $180

USO is rebounding from historic lows as oil prices maintain their upward momentum. The fund is currently targeting its fifth swing since the May 2020 recovery, bolstered by a bounce from the Daily blue box that provides a strong foundation for continued gains. In this analysis, we explore the next potential targets and identify the best strategies for traders to capitalize on the current market structure.
USO (United States Oil Fund) is an exchange-traded fund (ETF) designed to track the daily price movements of West Texas Intermediate (WTI) crude oil. Instead of holding physical oil, the fund primarily invests in near-term WTI crude oil futures contracts traded on the NYMEX.
On 8th Mar 2026, at the heat of the US/Israel-Iran war, the USO broke out of a sideways price action that lasted for over 3 years and 7 months. It was almost a forgotten one. Then came the crises in the Middle-east and the fund broke out. Early after the breakout happened, we shared the weekly chart below in a blog post on 8th March to alert traders and investors to buy the dips as it appeared more rallies would follow from the dips in the following weeks and months.
USO monthly – 8th March 2026
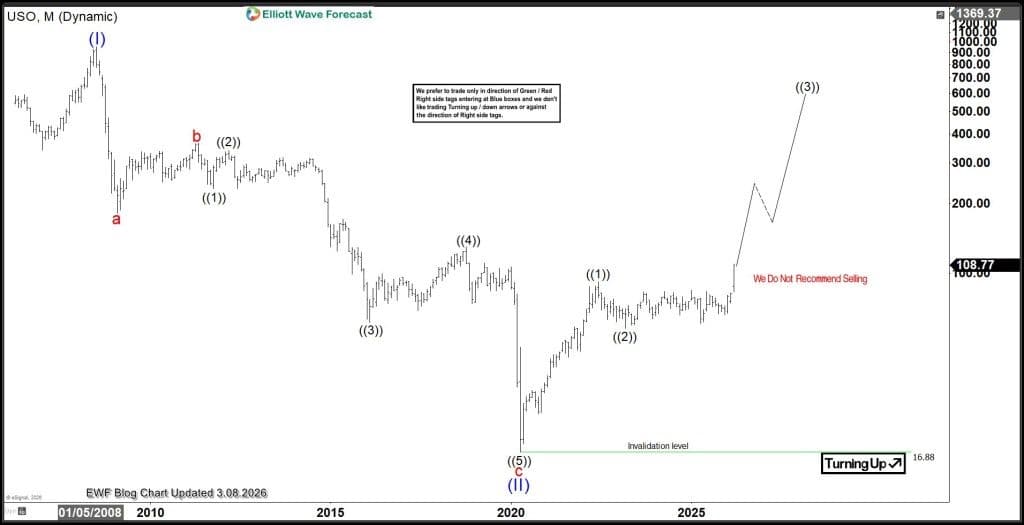
Following its January 2007 low of $340, the stock rallied over 180% to reach a peak of $953 in July 2008. This high marked a major turning point, after which the stock plummeted for 12 years, shedding 98% of its value to trade at approximately $17 by April 2020. Since that April 2020 low, the fund completed a 5-wave bounce and entered a period of sideways consolidation before the breakout in March 2026. While we anticipate further gains, the fund is not yet entirely out of the woods for two primary reasons:
1. Reliance on Oil Performance: The recent breakout appears driven almost exclusively by broader oil market trends.
2. Structural Alternative: While the decline from the 2008 peak could be viewed as a 3-wave corrective structure, the absence of overlapping price action and the presence of a clear 5-swing pattern suggest it may instead be a 5-wave impulse. Given this 50/50 structural outlook, the rally from the 2020 low could potentially be corrective, risking a return to new lows. However, because the all-time low sits significantly closer to zero than the last swing high, we assign a strong technical probability to a 5-wave rally from the low, which could extend into a larger-degree ABC pattern (at least) and initiate a multi-year bullish cycle.
USO weekly – 27th August 2026
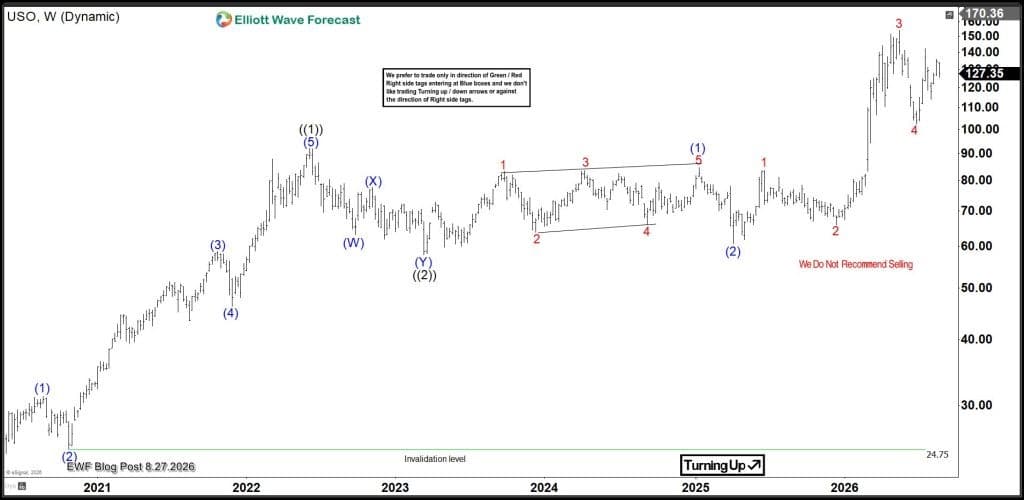
The provided weekly chart illustrates that the asset has completed its third swing post-breakout, which we identify as wave 3 of (3) of ((3)). Following this, a significant pullback occurred for wave 4, which successfully found support. Wave 5 of (3) is now emerging and could extend toward the $166–$186 range before initiating a wave (4) correction. While the previous wave 4 pullback served as an ideal long entry point, traders should now look to the upcoming wave (4) pullback as the next primary opportunity to establish a long position.
USO daily – 27th August 2026
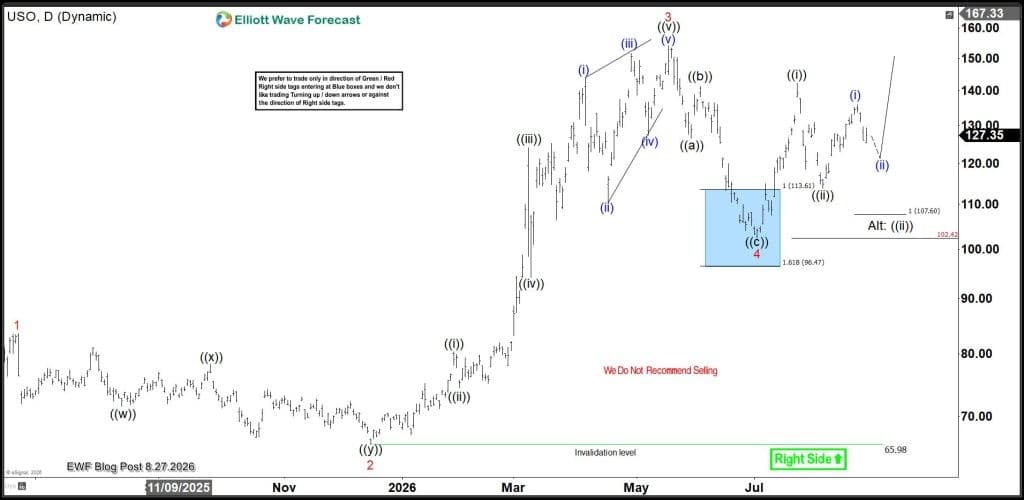
The daily chart confirms that the wave 4 pullback concluded within the 113.6–96.47 blue box zone. The subsequent surge from this area completed an impulse structure for wave ((i)) of 5. Traders who entered at the blue box and secured partial profits during the ((i)) rally should now adjust their remaining positions to breakeven to protect their capital.
Currently, the price is developing a nest in wave (ii) of ((iii)). For this count to remain valid, the price must hold above the 102.42 low. However, until we see a breakout above the recent (i) high, we cannot rule out a deeper correction for wave ((ii)) toward the 113.6–102.42 range, particularly near the 107.6 level.
What is the next setup?
Regarding new entries, it is essential to monitor how price action develops within this current nest. Potential scenarios include an impulsive breakout, a period of sideways consolidation, or a deeper wave ((ii)) correction that holds above the 102.42 support level. A less likely alternative is a decline from the May 18th high that extends below 102.42, which would invalidate the current immediate bullish structure. For optimal risk-adjusted entries, we recommend waiting for a confirmed breakout above the wave ((i)) high—or preferably above the wave 3 high—and subsequently looking to buy the ensuing dip.
Author

Elliott Wave Forecast Team
ElliottWave-Forecast.com
















