USD/CHF Price Forecast: US Dollar bears remain capped above 0.7800
- USD/CHF finds support at 0.7800 but remains capped below 0.7830.
- Hopes of a resolution of the Middle East conflict are weighing on the US Dollar recovery.
- Technically, the pair is in a bearish correction after the February-April uptrend.

The US Dollar (USD) is trading practically flat against the Swiss Franc (CHF) on Thursday, with the USD/CHF pair holding above the 0.7800 area for now, yet upside attempts are capped below the previous day's high at 0.7830, as hopes of a resolution of the Middle East Conflict are weighing on the safe-haven Greenback.
US President Donald Trump boosted market sentiment on Wednesday, affirming that negotiations between the US and Iran are “productive and ongoing” and that a new round of talks is likely to start soon.
Beyond that, Trump also said that Israel and Lebanon will hold direct talks in an attempt to reach a peace deal that would lay the ground for a steady resolution of the Middle East conflict. Lebanese authorities, however, have not confirmed that news.
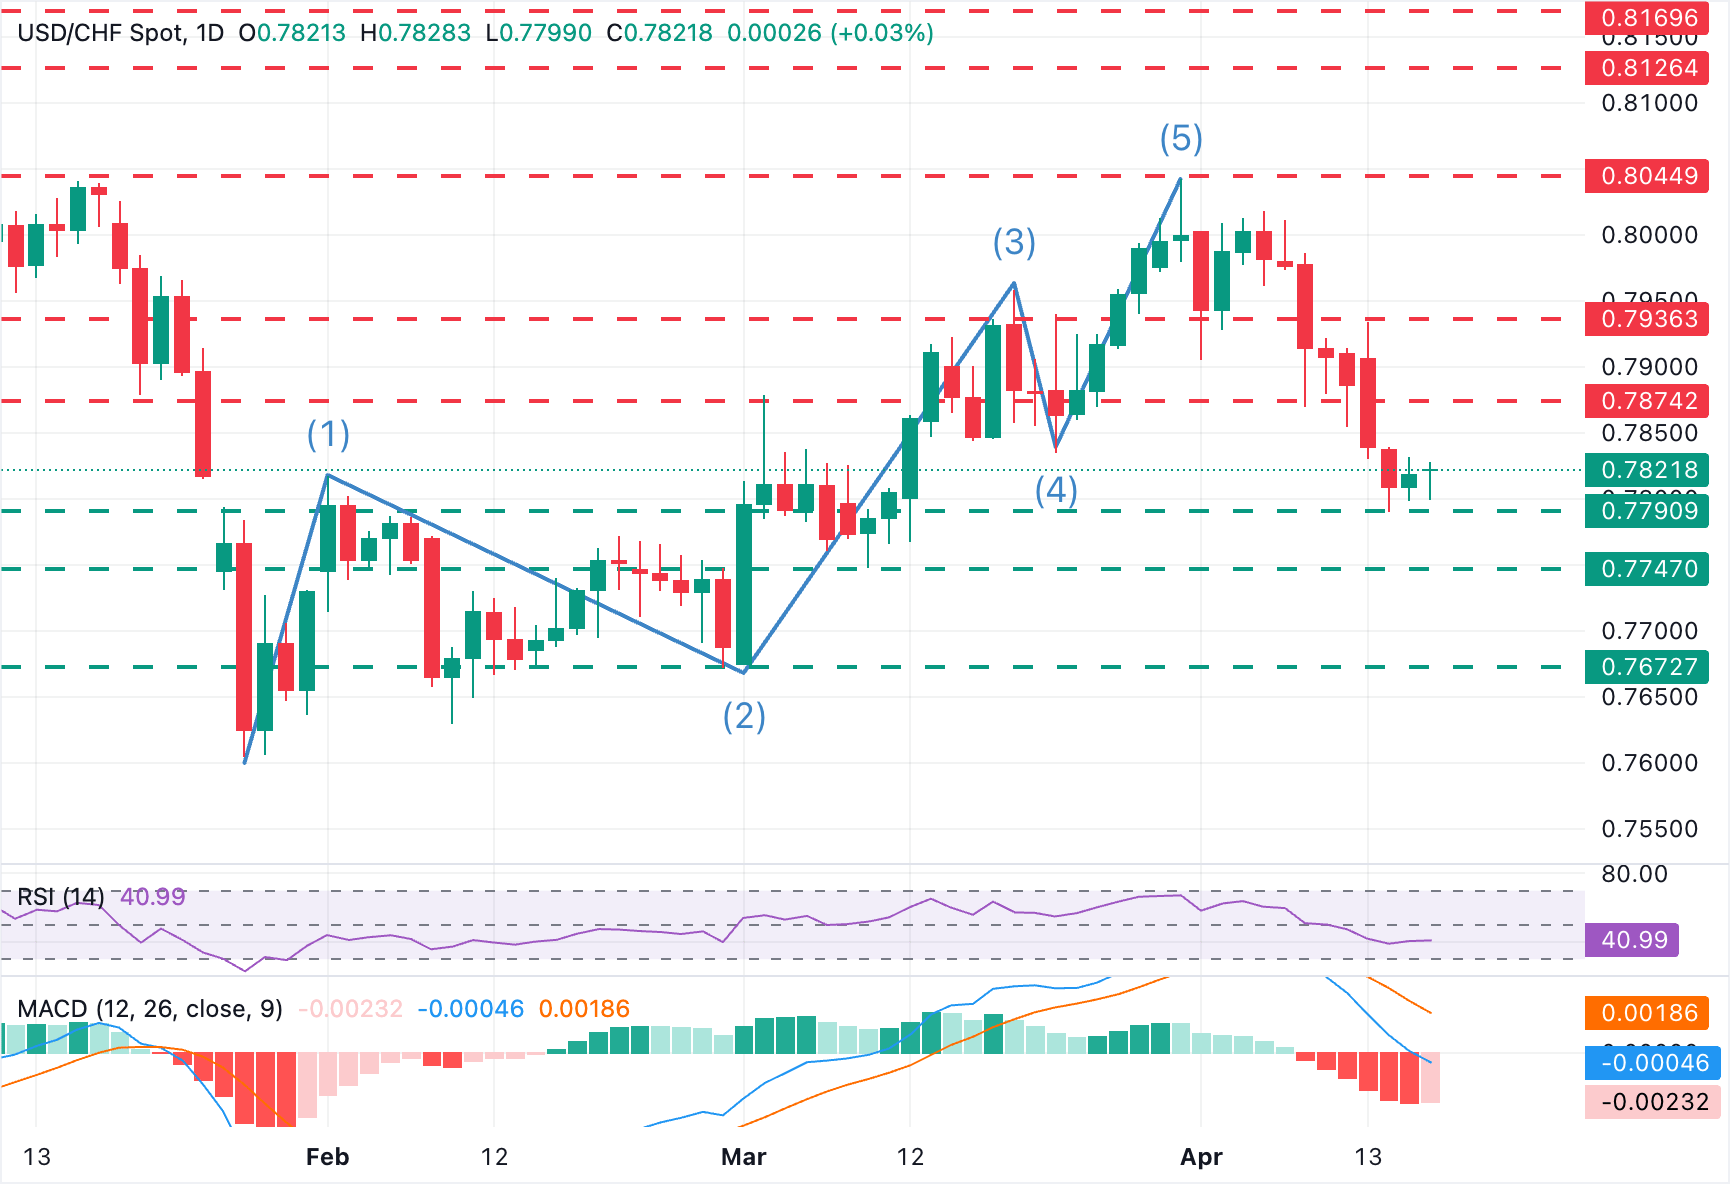
Technical Analysis
The USD/CHF's daily chart shows the pair in a bearish correction, following a 5-wave Elliot Wave bullish cycle. Technical indicators remain negative, although bearish momentum seems to have eased somewhat.
The Relative Strength Index (RSI) leans toward the bearish side of neutral, while the Moving Average Convergence Divergence (MACD) histogram remains in negative territory, together hinting that downside pressure still dominates despite the recent pause.
Elliot Wave cycles are often followed by A-B-C corrections, and the easing bearish pressure suggests that the pair might be ready for a pullback to the previous support area, now turned resistance, between April 8 and 10 lows in the 0.7855-0.7875 area, or even to the April 13 high, at 0.7834.
On the downside, below Tuesday's low, at 0.7790, the next targets are the March 10 low, at 0.7748, and the February 27 low, near 0.7670.
(The technical analysis of this story was written with the help of an AI tool.)
US Dollar Price Today
The table below shows the percentage change of US Dollar (USD) against listed major currencies today. US Dollar was the strongest against the New Zealand Dollar.
| USD | EUR | GBP | JPY | CAD | AUD | NZD | CHF | |
|---|---|---|---|---|---|---|---|---|
| USD | 0.13% | 0.05% | -0.02% | -0.12% | -0.07% | 0.25% | 0.08% | |
| EUR | -0.13% | -0.09% | -0.13% | -0.25% | -0.20% | 0.10% | -0.05% | |
| GBP | -0.05% | 0.09% | -0.04% | -0.17% | -0.13% | 0.19% | 0.03% | |
| JPY | 0.02% | 0.13% | 0.04% | -0.12% | -0.05% | 0.20% | 0.08% | |
| CAD | 0.12% | 0.25% | 0.17% | 0.12% | 0.06% | 0.36% | 0.20% | |
| AUD | 0.07% | 0.20% | 0.13% | 0.05% | -0.06% | 0.30% | 0.17% | |
| NZD | -0.25% | -0.10% | -0.19% | -0.20% | -0.36% | -0.30% | -0.15% | |
| CHF | -0.08% | 0.05% | -0.03% | -0.08% | -0.20% | -0.17% | 0.15% |
The heat map shows percentage changes of major currencies against each other. The base currency is picked from the left column, while the quote currency is picked from the top row. For example, if you pick the US Dollar from the left column and move along the horizontal line to the Japanese Yen, the percentage change displayed in the box will represent USD (base)/JPY (quote).
Author

Guillermo Alcala
FXStreet
Graduated in Communication Sciences at the Universidad del Pais Vasco and Universiteit van Amsterdam, Guillermo has been working as financial news editor and copywriter in diverse Forex-related firms, like FXStreet and Kantox.














