USD/CHF Price Forecast: Bulls reclaim 0.8000 as recovery stalls
- USD/CHF ends week lower after Treasury-led yield drop.
- RSI momentum favors sellers despite consolidation between key SMAs.
- Break below 0.7933 exposes 0.7900 as next support.

The USD/CHF advanced on Friday, registering a modest 0.07% gain, trading at 0.8010. During the week, the pair finished with losses of over 1.49%, triggered by a drop in US yields on Wednesday, as the US Treasury tries to cap elevated yields on the 30-year bond.
USD/CHF Price Forecast: Technical Outlook
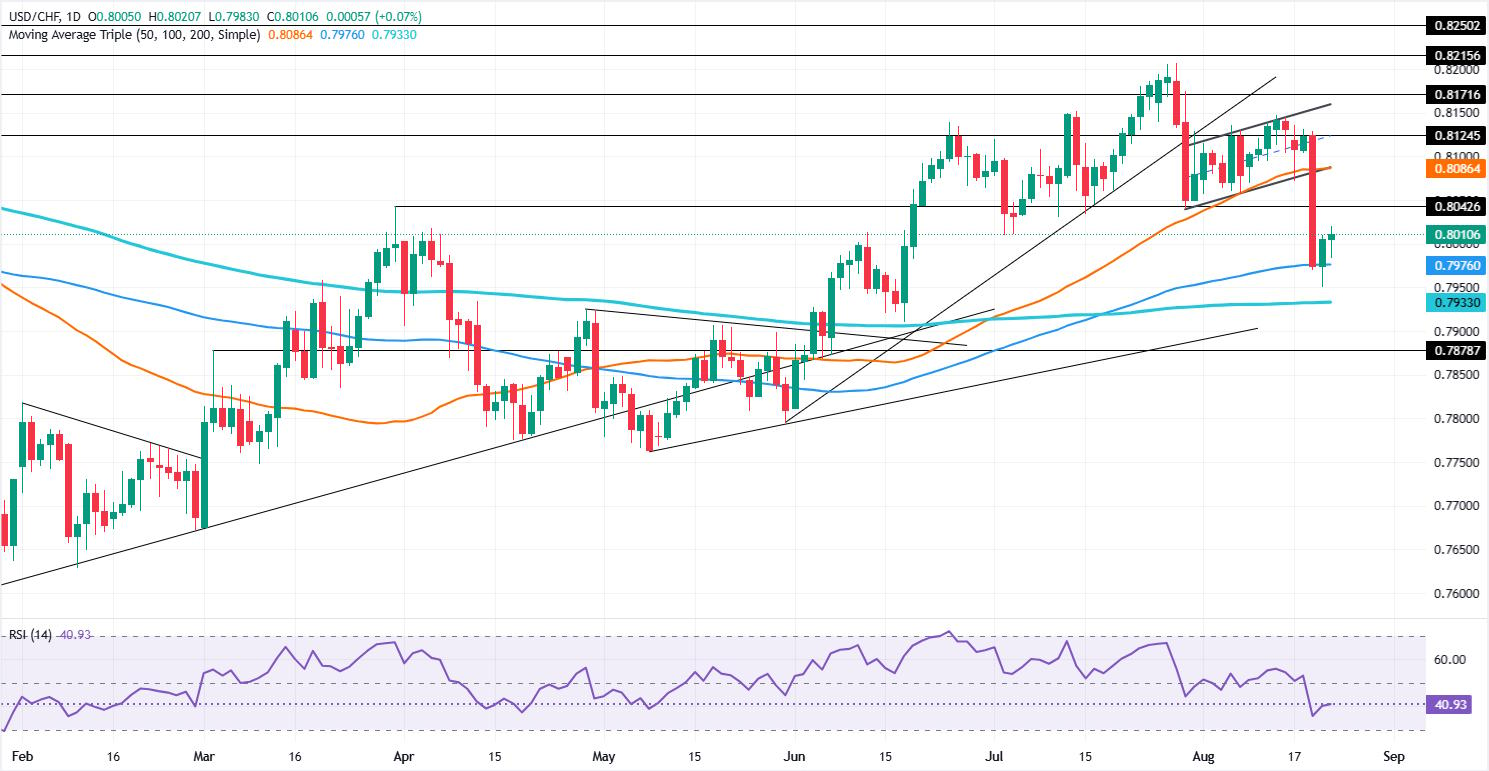
USD/CHF price action shows some “sort” of consolidation, capped by the 50- and 100-day Simple Moving Averages (SMAs) at 0.8086 and 0.7976. Momentum shifted downwards as seen in the Relative Strength Index (RSI).
Even though price action could’ve opened the door for a “mean reversion” trade after the sudden drop, the RSI suggests that bears are in charge and caution is warranted.
For a bearish continuation, the first support level for USD/CHF is 0.8000. Below the first support is the 100-day SMA, followed by the August 20 low of 0.7949, and then the 200-day SMA at 0.7933. A breach of the latter will expose 0.7900.
If USDCHF makes a U-turn and edges higher, the first resistance is the 50-day SMA at 0.8086. Above is 0.8100, followed by the August 13 high of 0.8147, before testing 0.8200.
USD/CHF Price Chart – Daily
Swiss Franc Price This week
The table below shows the percentage change of Swiss Franc (CHF) against listed major currencies this week. Swiss Franc was the strongest against the US Dollar.
| USD | EUR | GBP | JPY | CAD | AUD | NZD | CHF | |
|---|---|---|---|---|---|---|---|---|
| USD | -0.97% | -0.88% | -0.21% | -0.79% | -1.15% | -1.41% | -1.34% | |
| EUR | 0.97% | 0.22% | 0.74% | 0.18% | -0.24% | -0.50% | -0.38% | |
| GBP | 0.88% | -0.22% | 0.59% | -0.05% | -0.45% | -0.72% | -0.65% | |
| JPY | 0.21% | -0.74% | -0.59% | -0.61% | -0.92% | -1.21% | -1.13% | |
| CAD | 0.79% | -0.18% | 0.05% | 0.61% | -0.34% | -0.70% | -0.60% | |
| AUD | 1.15% | 0.24% | 0.45% | 0.92% | 0.34% | -0.27% | -0.21% | |
| NZD | 1.41% | 0.50% | 0.72% | 1.21% | 0.70% | 0.27% | 0.07% | |
| CHF | 1.34% | 0.38% | 0.65% | 1.13% | 0.60% | 0.21% | -0.07% |
The heat map shows percentage changes of major currencies against each other. The base currency is picked from the left column, while the quote currency is picked from the top row. For example, if you pick the Swiss Franc from the left column and move along the horizontal line to the US Dollar, the percentage change displayed in the box will represent CHF (base)/USD (quote).
Author

Christian Borjon Valencia
FXStreet
Markets analyst, news editor, and trading instructor with over 14 years of experience across FX, commodities, US equity indices, and global macro markets.