USD/CHF Price Forecast: Bulls clash at 100-day SMA, eyes on 0.7950
- USD/CHF gains as geopolitical tensions offset ceasefire optimism headlines.
- RSI improves as buyers gain traction near key resistance levels.
- Break above 0.7900 exposes 200-day SMA and 0.8000 target

The USD/CHF advanced by 0.24% on Tuesday as geopolitical tensions remained high, even after reports of a one-month ceasefire, according to Al Arabiya, citing Israeli Channel 12. At the time of writing, the pair trades at 0.7881 after bouncing off daily lows of 0.7859.
USD/CHF Price Forecast: Technical Outlook
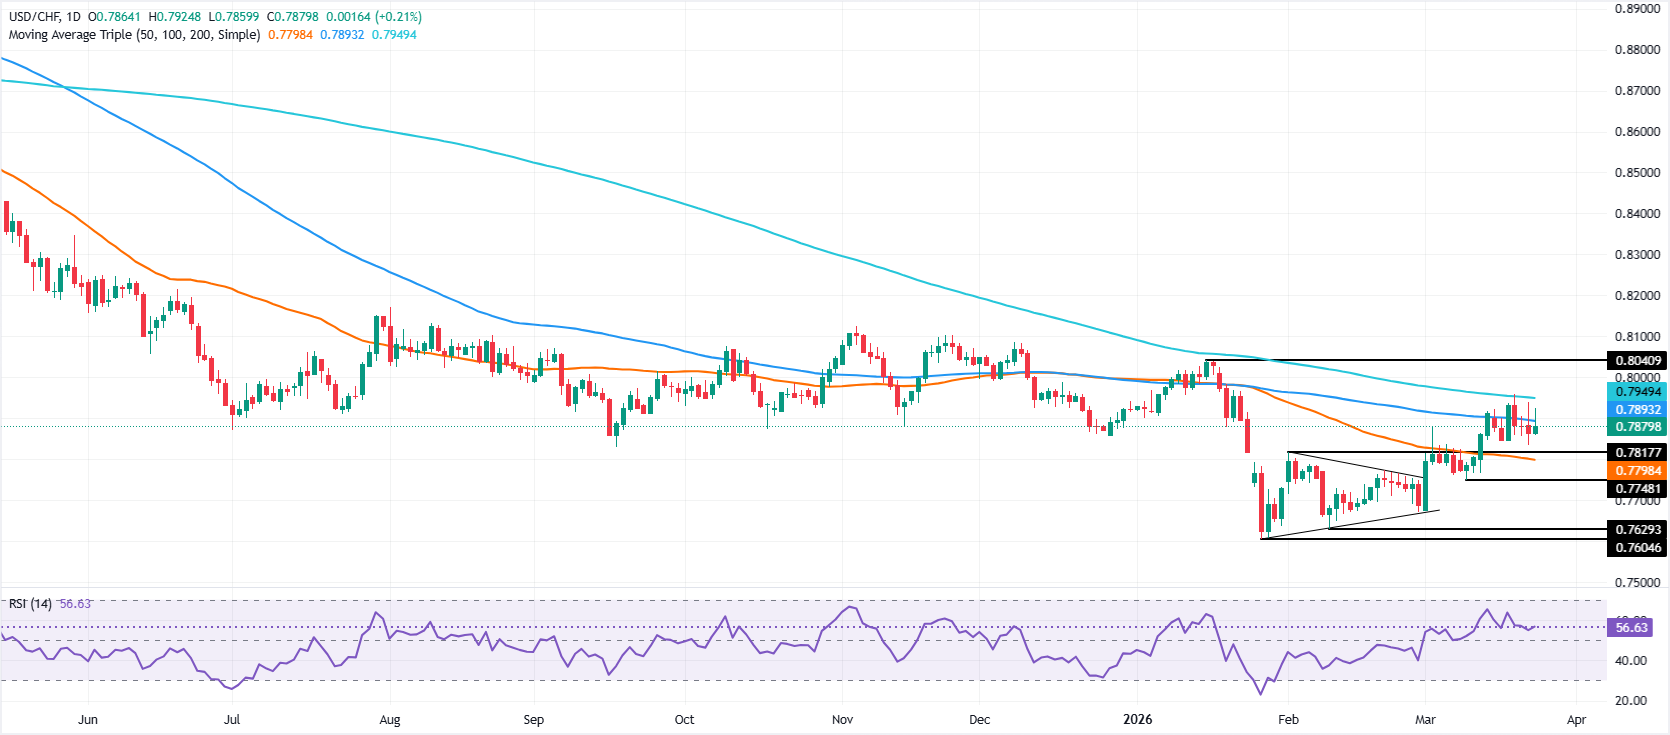
The technical picture shows that USD/CHF is neutral to bullish, even though it remains below the 200-day Simple Moving Average (SMA) at 0.7949.
Momentum, as measured by the Relative Strength Index (RSI), shows that buyers are gaining traction, though if they want to test higher prices, they must clear key resistance levels on the upside.
If USD/CHF clears the 100-day SMA of 0.7893, expect a test of the 0.7900 figure. Once cleared, the next area of interest will be the 200-day SMA at 0.7949, followed by the 0.8000 threshold.
On the bearish side, if USD/CHF tumbles below the March 23 daily low of 0.7834, it could open the door to a challenge of the 50-day SMA key support at 0.7798. On further weakness, a retracement towards the March 10 swing low of 0.7748 is on the cards.
USD/CHF Price Chart – Daily
Swiss Franc Price This week
The table below shows the percentage change of Swiss Franc (CHF) against listed major currencies this week. Swiss Franc was the strongest against the Canadian Dollar.
| USD | EUR | GBP | JPY | CAD | AUD | NZD | CHF | |
|---|---|---|---|---|---|---|---|---|
| USD | -0.67% | -0.80% | -0.43% | 0.30% | 0.02% | -0.33% | -0.06% | |
| EUR | 0.67% | -0.12% | 0.26% | 0.98% | 0.68% | 0.35% | 0.62% | |
| GBP | 0.80% | 0.12% | 0.34% | 1.10% | 0.82% | 0.47% | 0.67% | |
| JPY | 0.43% | -0.26% | -0.34% | 0.70% | 0.43% | 0.06% | 0.27% | |
| CAD | -0.30% | -0.98% | -1.10% | -0.70% | -0.26% | -0.63% | -0.37% | |
| AUD | -0.02% | -0.68% | -0.82% | -0.43% | 0.26% | -0.35% | -0.15% | |
| NZD | 0.33% | -0.35% | -0.47% | -0.06% | 0.63% | 0.35% | 0.20% | |
| CHF | 0.06% | -0.62% | -0.67% | -0.27% | 0.37% | 0.15% | -0.20% |
The heat map shows percentage changes of major currencies against each other. The base currency is picked from the left column, while the quote currency is picked from the top row. For example, if you pick the Swiss Franc from the left column and move along the horizontal line to the US Dollar, the percentage change displayed in the box will represent CHF (base)/USD (quote).
Author

Christian Borjon Valencia
FXStreet
Markets analyst, news editor, and trading instructor with over 14 years of experience across FX, commodities, US equity indices, and global macro markets.
















