USD/CAD Price Forecast: Falls to near 1.3550 after breaking below the ascending channel
- The USD/CAD pair may depreciate further as it has breached below the lower boundary of the ascending channel.
- The emergence of the bearish trend could push the pair to navigate the region around its six-month low of 1.3441.
- The immediate barrier appears at the nine-day EMA at 1.3574 level and the 14-day EMA at 1.3576 level.

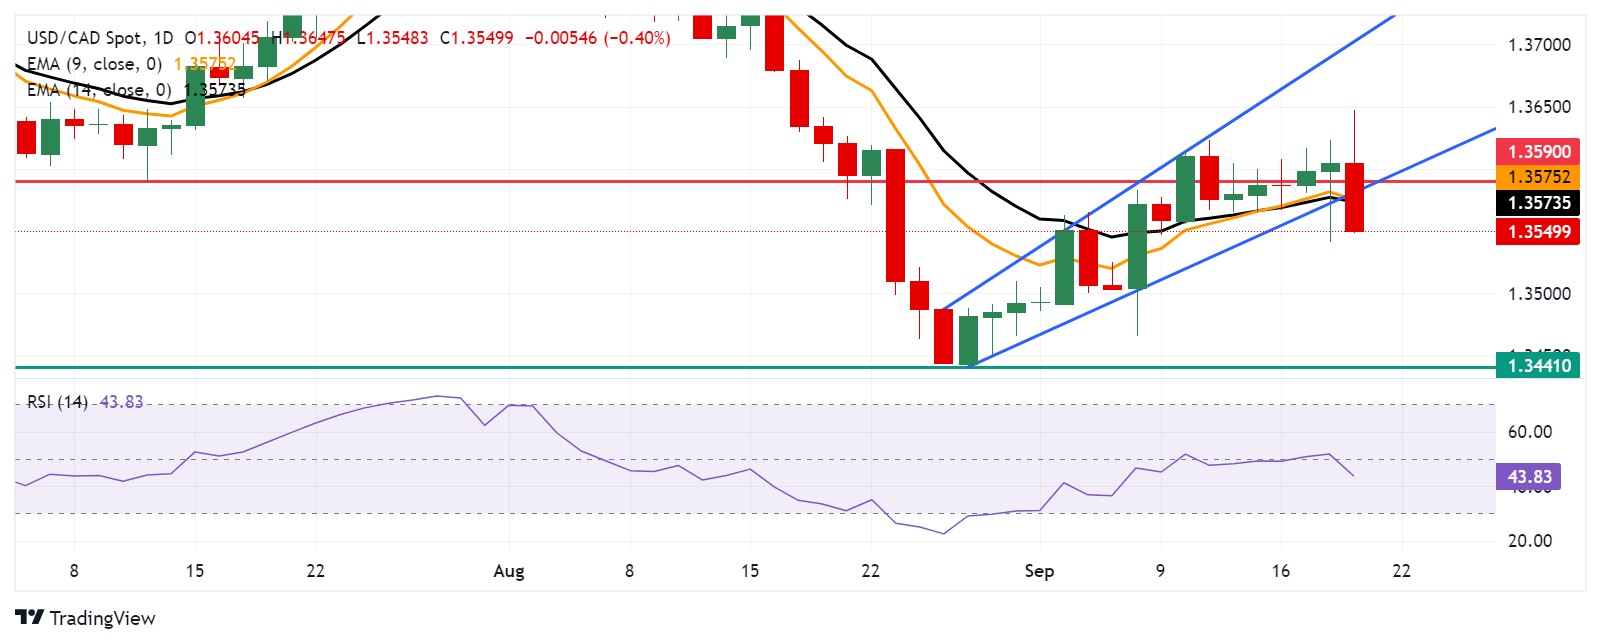
USD/CAD trades around 1.3550 during Thursday’s European hours. Analysis of the daily chart suggests a weakening of the bullish bias for the USD/CAD pair, as it has breached below the lower boundary of the ascending channel pattern.
Additionally, the 14-day Relative Strength Index (RSI) remains below the 50 level, confirming the bearish trend in play. Moreover, the nine-day Exponential Moving Average (EMA) is below the 14-day EMA, it indicates a weakening in the USD/CAD pair’s momentum.
On the downside, a break below the lower boundary of the ascending channel and the nine-day and the 14-day EMAs has triggered a bearish trend, potentially pressuring the USD/CAD pair to navigate the region around its six-month low of 1.3441, recorded on August 28.
Regarding the upside, the immediate barrier appears at the nine-day EMA at 1.3574 level, aligned with the 14-day EMA at 1.3576 level. A return to the ascending channel may reinforce the bullish bias and support the USD/CAD pair to test the "throwback support turns into a pullback resistance" level of 1.3590, followed by the psychological level of 1.3600.
USD/CAD: Daily Chart
Canadian Dollar PRICE Today
The table below shows the percentage change of Canadian Dollar (CAD) against listed major currencies today. Canadian Dollar was the strongest against the Japanese Yen.
| USD | EUR | GBP | JPY | CAD | AUD | NZD | CHF | |
|---|---|---|---|---|---|---|---|---|
| USD | -0.39% | -0.35% | 0.27% | -0.41% | -0.95% | -0.81% | -0.02% | |
| EUR | 0.39% | 0.04% | 0.67% | -0.01% | -0.53% | -0.42% | 0.38% | |
| GBP | 0.35% | -0.04% | 0.64% | -0.06% | -0.59% | -0.47% | 0.32% | |
| JPY | -0.27% | -0.67% | -0.64% | -0.67% | -1.21% | -1.12% | -0.31% | |
| CAD | 0.41% | 0.01% | 0.06% | 0.67% | -0.54% | -0.40% | 0.38% | |
| AUD | 0.95% | 0.53% | 0.59% | 1.21% | 0.54% | 0.13% | 0.92% | |
| NZD | 0.81% | 0.42% | 0.47% | 1.12% | 0.40% | -0.13% | 0.80% | |
| CHF | 0.02% | -0.38% | -0.32% | 0.31% | -0.38% | -0.92% | -0.80% |
The heat map shows percentage changes of major currencies against each other. The base currency is picked from the left column, while the quote currency is picked from the top row. For example, if you pick the Canadian Dollar from the left column and move along the horizontal line to the US Dollar, the percentage change displayed in the box will represent CAD (base)/USD (quote).
Author

Akhtar Faruqui
FXStreet
Akhtar Faruqui is a Forex Analyst based in New Delhi, India. With a keen eye for market trends and a passion for dissecting complex financial dynamics, he is dedicated to delivering accurate and insightful Forex news and analysis.


