USD/CAD Price Forecast: Eases from 1.3960 highs with the bullish trend in play
- USD/CAD eases from two-month highs in the 1.3960 area with the bullish trend still intact.
- US Dollar dips remain limited amid cautious markets and rising bets of Fed rate hikes.
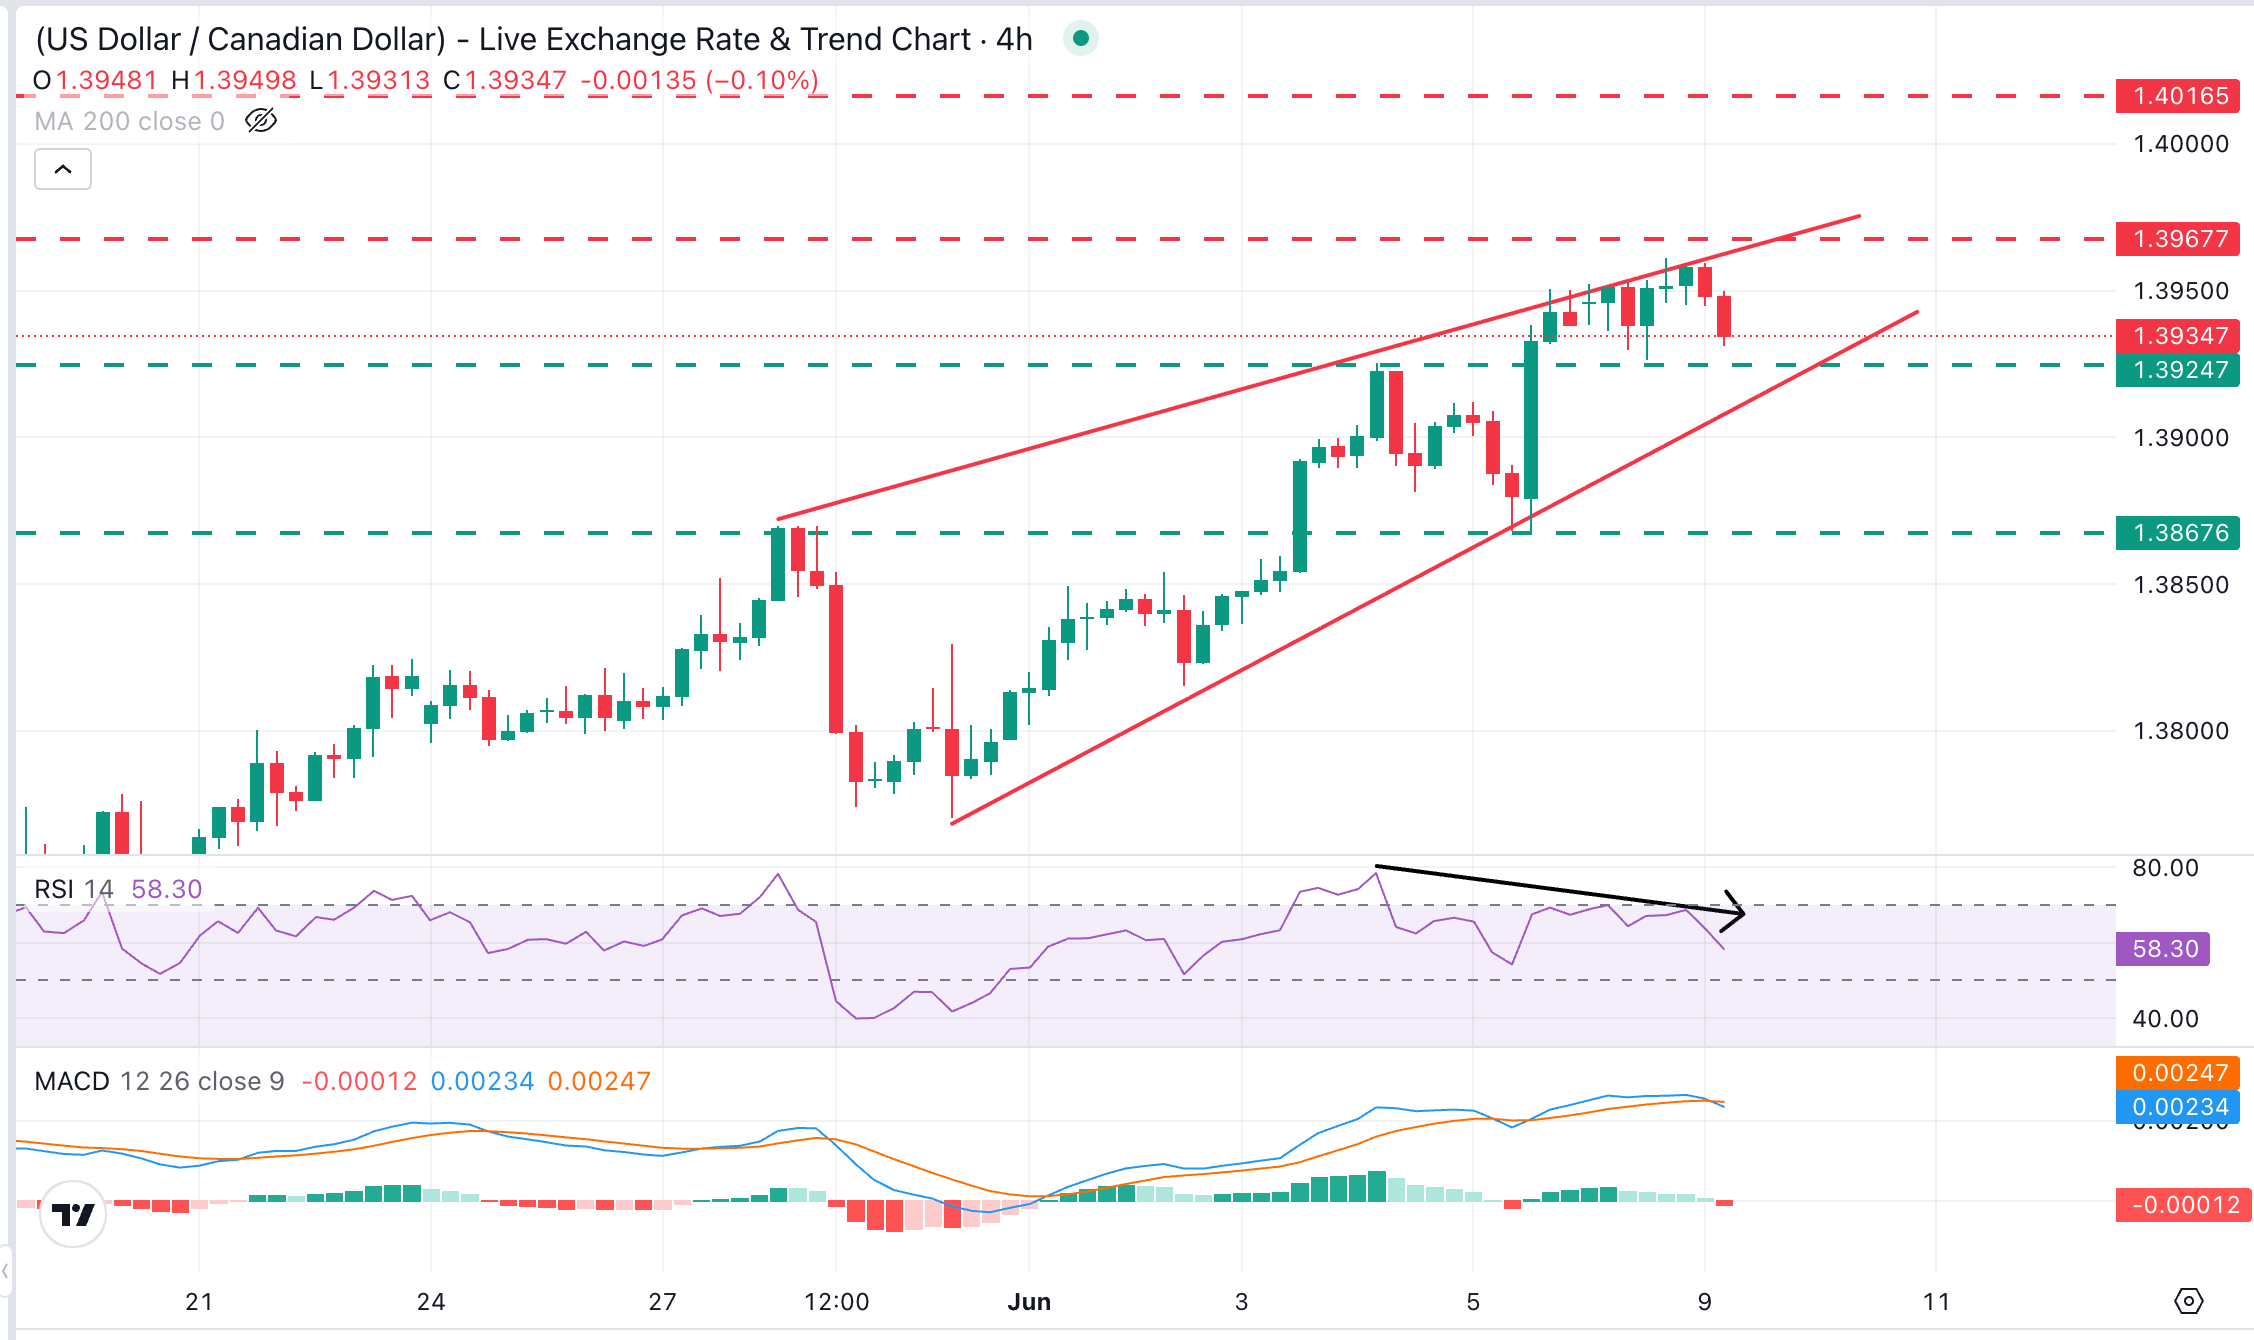
- The pair is forming an ending wedge, which hints at a potential trend change.

The US Dollar (USD) trades moderately lower against the Canadian Dollar (CAD) on Tuesday, pulling back from levels a few pips shy of the year-to-date peak, at 1.3966. The pair, however, maintains its bullish trend intact, fuelled by higher bets on Federal Reserve (Fed) tightening and safe-haven demand amid Middle East uncertainty
Markets show a mild optimism after Iran and Israel halted the hostilities and US President Donald Trump flagged a proposal for an agreement with Tehran. US Dollar dips, however, remain limited amid investors' scepticism after weeks of back-and-forth in the Middle East and a strong US Dollar, as strong US macroeconomic data released last week raised expectations that the Fed might hike rates this year if inflation pressures remain high.
Technical Analysis: Trading within an ending wedge
,
USD/CAD retains a constructive bias, yet with price action forming what looks like an ending wedge, suggesting that bulls might be losing steam following a steady rally from early May. Indicators in the 4-hour chart show a weakening momentum, with the Relative Strength Index (RSI) showing bearish divergence and the Moving Average Convergence Divergence (MACD) crossing below the Signal line, both negative signs.
Bears are set to test support at the June 4 high, near 1.3925, ahead of the wedge bottom, which now lies around 1.3905. A confirmation below here brings the June 5 low, near 1.3865, into focus.
Upside attempts, on the contrary, are likely to be tested at the confluence of late April highs with the wedge top, at 1.3965. Further up, the 1.4000 psychological level and December 2025 top, at 1.4014, emerge as the next targets.
(The technical analysis of this story was written with the help of an AI tool.)
US Dollar Price Today
The table below shows the percentage change of US Dollar (USD) against listed major currencies today. US Dollar was the strongest against the Japanese Yen.
| USD | EUR | GBP | JPY | CAD | AUD | NZD | CHF | |
|---|---|---|---|---|---|---|---|---|
| USD | -0.15% | -0.25% | -0.08% | -0.15% | -0.34% | -0.65% | -0.24% | |
| EUR | 0.15% | -0.07% | 0.09% | 0.00% | -0.15% | -0.47% | -0.06% | |
| GBP | 0.25% | 0.07% | 0.17% | 0.10% | -0.10% | -0.38% | 0.02% | |
| JPY | 0.08% | -0.09% | -0.17% | -0.07% | -0.26% | -0.57% | -0.16% | |
| CAD | 0.15% | -0.00% | -0.10% | 0.07% | -0.19% | -0.48% | -0.08% | |
| AUD | 0.34% | 0.15% | 0.10% | 0.26% | 0.19% | -0.29% | 0.11% | |
| NZD | 0.65% | 0.47% | 0.38% | 0.57% | 0.48% | 0.29% | 0.40% | |
| CHF | 0.24% | 0.06% | -0.02% | 0.16% | 0.08% | -0.11% | -0.40% |
The heat map shows percentage changes of major currencies against each other. The base currency is picked from the left column, while the quote currency is picked from the top row. For example, if you pick the US Dollar from the left column and move along the horizontal line to the Japanese Yen, the percentage change displayed in the box will represent USD (base)/JPY (quote).
Author

Guillermo Alcala
FXStreet
Graduated in Communication Sciences at the Universidad del Pais Vasco and Universiteit van Amsterdam, Guillermo has been working as financial news editor and copywriter in diverse Forex-related firms, like FXStreet and Kantox.

















