USD/CAD Price Forecast: Bullish Flag pattern underway
- The USD/CAD pair ticks higher to near 1.4023 ahead of US-Canada employment data.
- The Fed is expected to hike interest rates at the September meeting.
- A bullish flag pattern is in the making, suggesting that the overall trend is still bullish.

The Canadian Dollar (CAD) trades marginally lower against the US Dollar (USD) on Friday, with the USD/CAD pair edging up to near 1.4023 in the European trading session. The Loonie pair is expected to trade sideways as investors await the labor market data for July from both the United States (US) and Canada.
Investors will pay close attention to both datasets to get fresh cues regarding the Federal Reserve (Fed) and the Bank of Canada’s (BoC) monetary policy outlook.
US jobs report in focus as Danske Bank sees solid labor backdrop
Analysts at Danske Bank highlight that “the most important data release will be the US July Jobs Report,” where they “forecast nonfarm payrolls at +70k, the unemployment rate unchanged at 4.2%, and average hourly earnings at +0.3% m/m s.a.” The bank notes that “most leading data still point towards solid labour market conditions, although weak labour supply growth also weighs on the employment growth outlook,” adding that “the unemployment rate remains the Fed's primary focus.”
The CME FedWatch tool shows a 54.5% chance that the Fed will raise interest rates in the September policy meeting.
Meanwhile, the Canadian labor market report is expected to show that the economy created 15K fresh jobs, slightly lower than 18.2K in June. The Unemployment Rate is seen as steady at 6.5%.
USD/CAD Technical Analysis
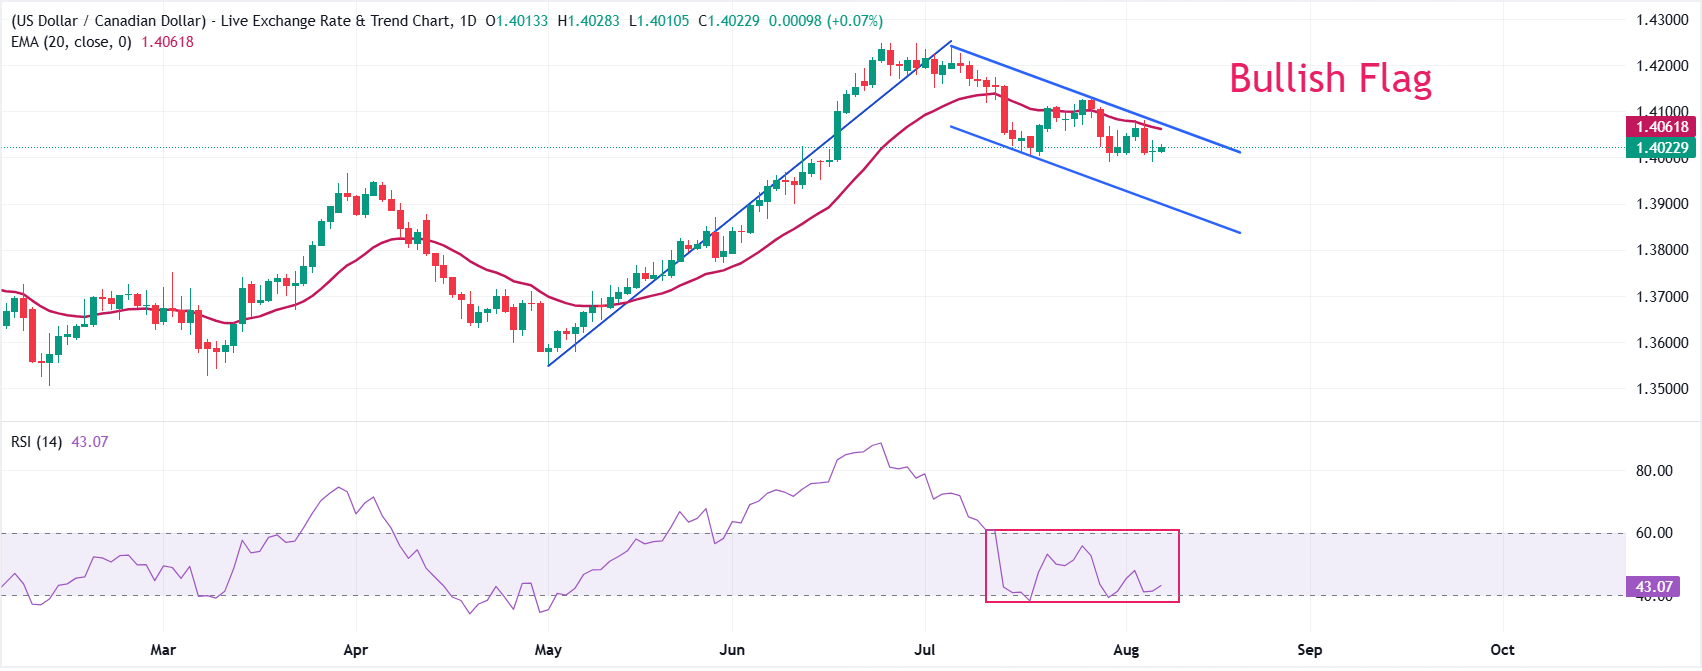
USD/CAD trades at 1.4023, retaining a bearish near-term bias as price holds below the 20-period Exponential Moving Average (EMA) at 1.4062. However, the formation of a Bullish Flag chart pattern suggests that the overall trend is still bullish.
The Relative Strength Index (RSI) at 43.1 sits just under neutral, hinting at subdued downside momentum rather than outright oversold conditions.
On the topside, immediate resistance is clustered between the 20-period EMA at 1.4062 and the channel top at 1.4076; a decisive break above that zone would open the way for an upside move towards 1.4200. On the downside, the lower boundary of the Bullish Flag channel at around 1.3902 will be the key support level.
(The technical analysis of this story was written with the help of an AI tool. Know more.)
Employment FAQs
Labor market conditions are a key element to assess the health of an economy and thus a key driver for currency valuation. High employment, or low unemployment, has positive implications for consumer spending and thus economic growth, boosting the value of the local currency. Moreover, a very tight labor market – a situation in which there is a shortage of workers to fill open positions – can also have implications on inflation levels and thus monetary policy as low labor supply and high demand leads to higher wages.
The pace at which salaries are growing in an economy is key for policymakers. High wage growth means that households have more money to spend, usually leading to price increases in consumer goods. In contrast to more volatile sources of inflation such as energy prices, wage growth is seen as a key component of underlying and persisting inflation as salary increases are unlikely to be undone. Central banks around the world pay close attention to wage growth data when deciding on monetary policy.
The weight that each central bank assigns to labor market conditions depends on its objectives. Some central banks explicitly have mandates related to the labor market beyond controlling inflation levels. The US Federal Reserve (Fed), for example, has the dual mandate of promoting maximum employment and stable prices. Meanwhile, the European Central Bank’s (ECB) sole mandate is to keep inflation under control. Still, and despite whatever mandates they have, labor market conditions are an important factor for policymakers given its significance as a gauge of the health of the economy and their direct relationship to inflation.
Author

Sagar Dua
FXStreet
Sagar Dua is associated with the financial markets from his college days. Along with pursuing post-graduation in Commerce in 2014, he started his markets training with chart analysis.















