USD/CAD Price Forecast: US Dollar bears gain momentum below 14200
- USD/CAD hits session lows below 1.4170 with bearish momentum building up.
- Fed Chairman Kevin Warsh has failed to provide any relevant hints about the bank's next steps.
- BoC governor Macklem suggested that inflationary pressures are posing a challenge for Canada's central bank.

The Canadian Dollar (CAD) maintains its firm tone on Friday, buoyed by elevated Oil prices, while the US Dollar (USD) struggles amid lower US Treasury yields and dovish comments by Fed speakers. The USD/CAD pair trades at session lows just below 1.4170, under growing bearish pressure, after breaching the 1.4200 support area on Thursday.
US producer inflation data released on Thursday confirmed that price pressures remain high, and Retail Sales beat expectations. The impact of these releases on the US Dollar, however, was limited, as Federal Reserve (Fed) officials suggested earlier this week that the bank will stand pat on rates in October to assess the impact of September’s interest rate hike.
The Federal Reserve Chairman, Kevin Warsh, spoke at the International Monetary Fund (IMF) forum in Bangkok earlier on Friday but failed to give any clear hints about the timing of the next rate hike.
Bank of Canada (BoC) Governor, Tiff Macklem, also speaking at the IMF forum, highlighted that the BoC is one of the few major central banks lagging in the global monetary tightening cycle, but that "the longer this goes, the harder that gets,” opening the door for an interet rate hike in the coming months.
Technical Analysis: bears are testing support at 1.4160
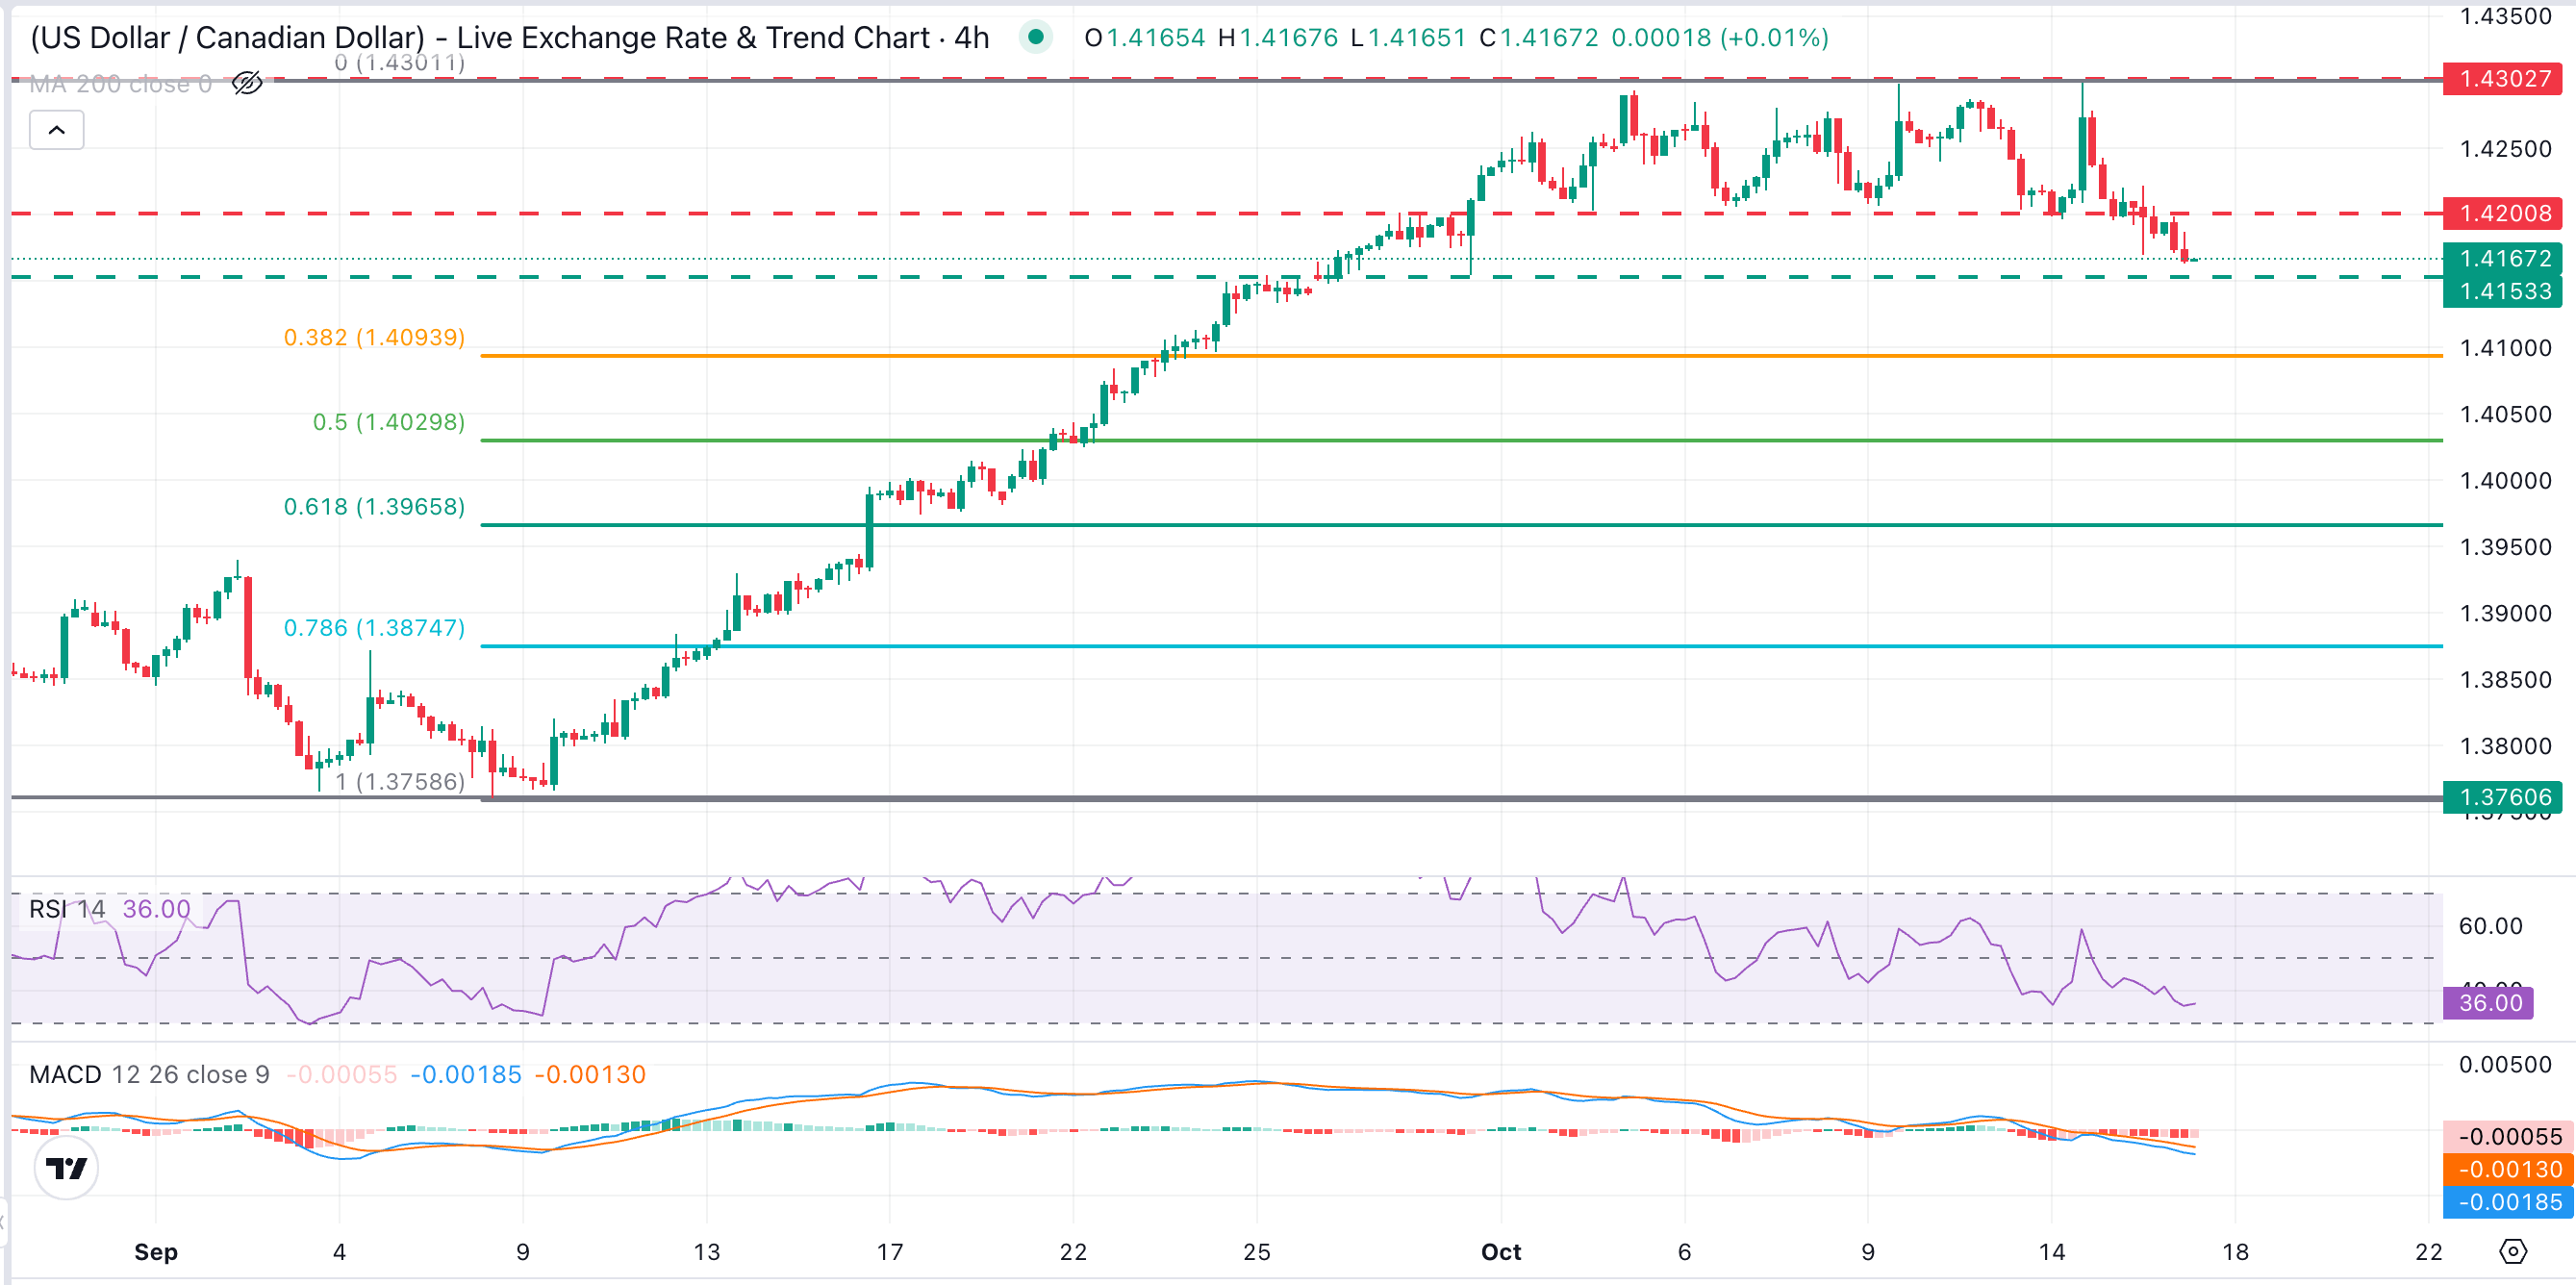
USD/CAD trades at 1.4166, retaining a mildly negative tone with bears testing support around the 1.4155 area. The 4-hour Relative Strength Index (14) near 35 suggests waning upside momentum, while the Moving Average Convergence Divergence (MACD) remains negative, reinforcing the idea that rebounds are likely to struggle beneath the 1.4200 level.
If the mentioned 1.4155 (September 29 high, October 2 low) gives way, sellers are likely to be attracted by the 38.2% Fibonacci retracement of the September-October rally, in the 1.4100 area.
Upside attempts, on the contrary, are likely to be tested at the previous support area around 1.4200 (October 6, 9 and 13 lows). Above here, the focus would shift back to the 17-month highs around 1.4300, which have capped bulls several times in October
(The technical analysis of this story was written with the help of an AI tool. Know more.)
Canadian Dollar Price Today
The table below shows the percentage change of Canadian Dollar (CAD) against listed major currencies today. Canadian Dollar was the strongest against the Japanese Yen.
| USD | EUR | GBP | JPY | CAD | AUD | NZD | CHF | |
|---|---|---|---|---|---|---|---|---|
| USD | -0.18% | -0.28% | 0.05% | -0.13% | -0.56% | -0.78% | -0.22% | |
| EUR | 0.18% | -0.12% | 0.20% | 0.03% | -0.37% | -0.62% | -0.05% | |
| GBP | 0.28% | 0.12% | 0.32% | 0.17% | -0.27% | -0.49% | 0.07% | |
| JPY | -0.05% | -0.20% | -0.32% | -0.16% | -0.59% | -0.79% | -0.26% | |
| CAD | 0.13% | -0.03% | -0.17% | 0.16% | -0.42% | -0.70% | -0.10% | |
| AUD | 0.56% | 0.37% | 0.27% | 0.59% | 0.42% | -0.23% | 0.36% | |
| NZD | 0.78% | 0.62% | 0.49% | 0.79% | 0.70% | 0.23% | 0.59% | |
| CHF | 0.22% | 0.05% | -0.07% | 0.26% | 0.10% | -0.36% | -0.59% |
The heat map shows percentage changes of major currencies against each other. The base currency is picked from the left column, while the quote currency is picked from the top row. For example, if you pick the Canadian Dollar from the left column and move along the horizontal line to the US Dollar, the percentage change displayed in the box will represent CAD (base)/USD (quote).
Author

Guillermo Alcala
FXStreet
Graduated in Communication Sciences at the Universidad del Pais Vasco and Universiteit van Amsterdam, Guillermo has been working as financial news editor and copywriter in diverse Forex-related firms, like FXStreet and Kantox.

















