|

USD/CAD Price Analysis: Sets for a smooth ride as oil continues bloodbath, US/Canada Employment data eyed

  • USD/CAD is preparing for further side as oil prices continue to bleed amid fears of a global economic slowdown.
  •  Later this week, US/Canada Employment data will be keenly watched.
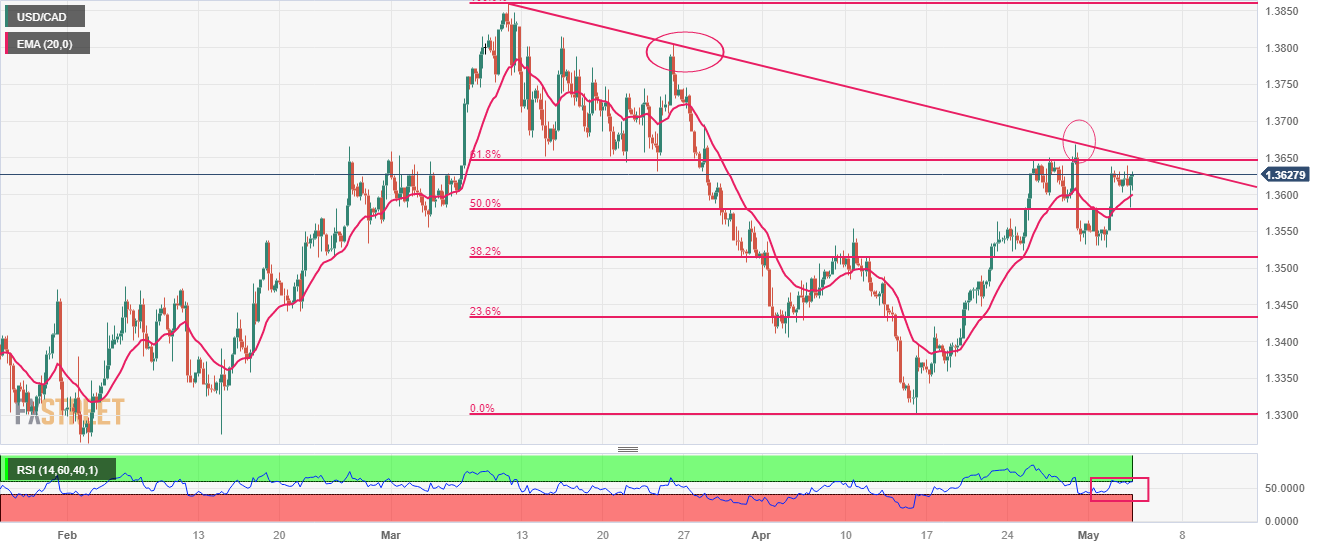
  • USD/CAD is approaching the 61.8% Fibonacci retracement plotted at 1.3648.

The USD/CAD pair has turned sideways after a perpendicular rally to near 1.3630 in the early Asian session. The Loonie asset is gathering strength for further upside as a bloodbath in oil prices amid deepening fears of a global economic slowdown due to higher interest rates from central banks. The street is worried about the oil demand outlook as tight liquidity conditions would force firms to underutilize their production capacities.

Oil prices have refreshed their annual low of $63.60 after the Federal Reserve (Fed) hikes interest rates by 25 basis points (bps) to 5.00-5.25%.

Going forward, the Canadian Dollar will dance to the tunes of Friday’s Employment data (April). The net change in Employment is seen at 20K higher than the former addition of 34.7K. The Unemployment Rate is expected to increase to 5.1%.

Also, the US Employment data (April) will be keenly watched. The US Nonfarm Payrolls (NFP) data is seen at 179K lower than the former release of 236K.

USD/CAD is approaching the 61.8% Fibonacci retracement (placed from March 10 high at 1.3862 to April 14 low at 1.3301) at 1.3648. The downward-sloping trendline from March 10 high at 1.3862 has acted as a major barricade for the US Dollar bulls.

The 20-period Exponential Moving Average (EMA) at 1.3600 is providing cushion to the US Dollar bulls.

Meanwhile, the Relative Strength Index (RSI) (14) is making efforts for shifting into the bullish range of 60.00-80.00. An occurrence of the same will activate the bullish momentum.

An extension in a recovery move above the 61.8% Fibo retracement at 1.3650 will trigger a reversal and will drive the major toward the round-level resistance at 1.3700. A break above the same will expose the asset to March 22 high at 1.3745.

On the flip side, a decisive break below May 02 low at 1.3529 will expose the asset to psychological support at 1.3500 followed by a 23.6% Fibo retracement at 1.3438.

USD/CAD four-hour chart
USD/CAD

Overview
Today last price1.3625
Today Daily Change-0.0001
Today Daily Change %-0.01
Today daily open1.3626
 
Trends
Daily SMA201.3498
Daily SMA501.3589
Daily SMA1001.3527
Daily SMA2001.3436
 
Levels
Previous Daily High1.3638
Previous Daily Low1.3529
Previous Weekly High1.3668
Previous Weekly Low1.3523
Previous Monthly High1.3668
Previous Monthly Low1.3301
Daily Fibonacci 38.2%1.3596
Daily Fibonacci 61.8%1.357
Daily Pivot Point S11.3557
Daily Pivot Point S21.3488
Daily Pivot Point S31.3448
Daily Pivot Point R11.3666
Daily Pivot Point R21.3706
Daily Pivot Point R31.3775

Author

Sagar Dua

Sagar Dua

FXStreet

Sagar Dua is associated with the financial markets from his college days. Along with pursuing post-graduation in Commerce in 2014, he started his markets training with chart analysis.


More from Sagar Dua
Share:

Editor's Picks

AUD/USD rises to 0.6950 as USD slips on Fed's Warsh

AUD/USD regains traction and extends the bounce toward 0.6950 in the Asian session on Friday. Fed Chair Warsh's comments reinforce the selling pressure on the US Dollar, allowing the pair to stretch higher. Warsh said that he remains committed to delivering price stability without giving away anything on future interest rate path.

USD/JPY falls in symc with USD, gives up 158.00 after Warsh's speech

USD/JPY has come under fresh selling pressure and gives up 158.00 in the Asian session on Friday amid the emergence of fresh US Dollar selling. Fed Chair Warsh's non-committal commentary on the future tightening path, weighs on the US Dollar and the pair.

Gold looks vacillating above $4,150

Gold alternates gains with losses below the key $4,200 mark per troy ounce on Friday. The yellow metal’s irresolute price action comes in response to a modest pullback in the US Dollar and a tepid recovery in US Treasury yields across the board.

Bitcoin steadies at $82,000: The five forces crushing the Uptober rally

Crypto markets have remained under pressure so far in October, with Bitcoin (BTC) sliding below $80,000 earlier this week before recovering to around $82,000 on Friday, as macroeconomic headwinds and cooling demand weigh on the market.

The Fed just got a second hot inflation number. Here's what the diesel signal is really saying
The Federal Reserve (Fed) faces a renewed inflation challenge after two consecutive reports showed price pressure intensifying across the US economy. September's Consumer Price Index (CPI) confirmed accelerating consumer inflation, while the Producer Price Index (PPI) revealed an even sharper rise in business costs. Behind both reports lies a common factor: energy prices.
Everyone's dumping Gold after hot US inflation. Here's why $4,100 could be a floor, not a cliff
Gold (XAU/USD) is recovering from a sharp sell-off triggered by hotter-than-expected United States (US) inflation data released on Wednesday. The precious metal briefly plunged toward $4,073 as investors increased their bets on further Federal Reserve (Fed) interest rate hikes before recovering as US Treasury yields and the US Dollar (USD) reversed their initial gains.














