|

USD/CAD Price Analysis: Poised for continued losses after breaking support trendline, YTD low in sight

  • USD/CAD continues its downward trajectory, trading at 1.3207, showing minor losses of 0.01%.
  • A break below 1.3200 may open the way to YTD lows, with RSI indicating oversold conditions.
  • If USD/CAD trades above the May 8 daily low of 1.3314, the pair could stabilize, with the 20-day EMA at 1.3357 as the first resistance.

USD/CAD trimmed some of its losses last Friday on Monday, though as the Asian session begins, it is poised to extend its ongoing losses during the previous three weeks. The USD/CAD is trading at 1.3207, down 0.01%, after hitting a weekly high of 1.3229.

USD/CAD Price Analysis: Technical outlook

During the last week, the USD/CAD broke a support trendline drawn from 2022 November lows, surpassing around 1.3314. That exacerbated the USD/CAD fall to new year-to-date (YTD) lows of 1.3177 before rebounding above 1.3200.

It should be said the pair bias is downward, but if the USD/CAD trades above the May 8 daily low of 1.3314, that could pave the way for sideways action. If that outcome continues, the USD/CAD first resistance would be the 20-day Exponential Moving Average (EMA) at 1.3357, followed by the 200-day EMA at 1.3405.

Conversely, if USD/CAD drops below 1.3200, further downside is expected, with the pair challenging the YTD low, followed by the September 13 low of 1.2954.

Notably, the Relative Strength Index (RSI) portrays the pair as oversold, while the three-day Rate of Change (RoC) indicates the pair is heading downwards.

USD/CAD Price Action – Daily chart
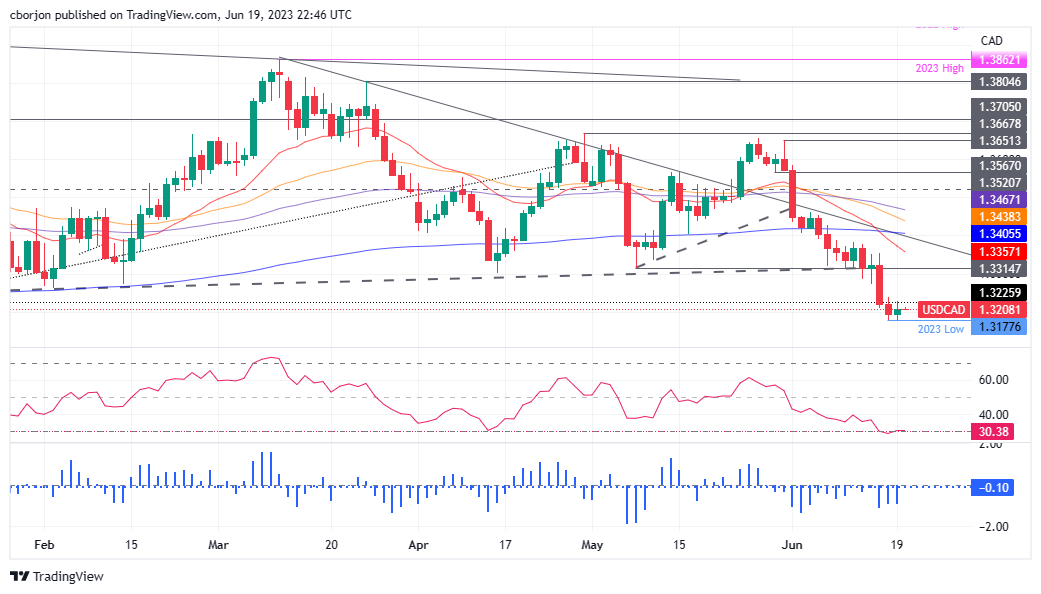
USD/CAD Daily chart

USD/CAD

Overview
Today last price1.3208
Today Daily Change0.0010
Today Daily Change %0.08
Today daily open1.3198
 
Trends
Daily SMA201.3443
Daily SMA501.3469
Daily SMA1001.3512
Daily SMA2001.3518
 
Levels
Previous Daily High1.3239
Previous Daily Low1.3178
Previous Weekly High1.3384
Previous Weekly Low1.3178
Previous Monthly High1.3655
Previous Monthly Low1.3315
Daily Fibonacci 38.2%1.3201
Daily Fibonacci 61.8%1.3216
Daily Pivot Point S11.3171
Daily Pivot Point S21.3143
Daily Pivot Point S31.3109
Daily Pivot Point R11.3232
Daily Pivot Point R21.3267
Daily Pivot Point R31.3294

Author

Christian Borjon Valencia

Markets analyst, news editor, and trading instructor with over 14 years of experience across FX, commodities, US equity indices, and global macro markets.


More from Christian Borjon Valencia
Share:

Editor's Picks

AUD/USD holds above multi-month lows and 0.6900 ahead of Fed's Warsh

AUD/USD struggles to capitalize on the previous day's modest bounce from its lowest level since early July and trades above 0.6900 during the Asian session on Friday. Thursday's disappointing Australian jobs data tempered RBA rate-hike bets, capping the Aussie. The US Dollar (USD), meanwhile, is regaining positive traction as this week's hot US CPI and PPI reports keep Fed rate hike bets firmly on the table. This further keeps a lid on the pair ahead of Fed Chair Kevin Warsh speech.

USD/JPY climbs above 158.00 as USD edges higher ahead of Warsh's speech

USD/JPY attracts some buyers during the Asian session on Friday, building on the overnight bounce from the vicinity of 157.50, or a one-week low, amid the emergence of some US Dollar buying. This week's hot US CPI and PPI reports lifted Fed rate-hike bets, which, along with stable US bond yields and geopolitical uncertainties, help revive USD demand. Traders, however, remain on high alert amid speculation that authorities will step in to prop up the Japanese Yen, which could cap the currency pair ahead of Fed Chair Kevin Warsh's speech.

Gold weakens to $4,150 amid reviving USD demand as traders await Warsh's speech

Gold drifts lower during the Asian session on Friday, reversing part of the previous day's move up amid reviving US Dollar demand. US inflation data released this week reaffirmed bets for at least one Fed rate hike this year, while US bond yields stabilize after Thursday's steep decline. This, along with geopolitical risks, underpins the safe-haven USD, which, in turn, is seen weighing on bullion ahead of Fed Chair Kevin Warsh's speech.

Ethereum reclaims $2,400 as PPI hits 6.3% and yields fall
Ethereum (ETH) is back above $2,400 on Thursday, rebounding from a brief decline toward $2,340, which was sparked by an upside surprise in the US wholesale inflation report. The Producer Price Index (PPI) increased 1.3% monthly and 6.3% annually in September, far above expectations of 0.5% and 5.3%, respectively.
The Iran war will eventually end. Tariffs won't. Here's the problem
Two cost shocks are in the September Consumer Price Index (CPI), and they have different half-lives. Energy is up 20.4% on the year and accounts for about 1.3 points of the 3.7% headline, and that shock reverses when Oil does: Brent was back at its pre-war price on July 1 and above $100 again by the end of the month, after the ceasefire collapsed on July 8.
Everyone's dumping Gold after hot US inflation. Here's why $4,100 could be a floor, not a cliff
Gold (XAU/USD) is recovering from a sharp sell-off triggered by hotter-than-expected United States (US) inflation data released on Wednesday. The precious metal briefly plunged toward $4,073 as investors increased their bets on further Federal Reserve (Fed) interest rate hikes before recovering as US Treasury yields and the US Dollar (USD) reversed their initial gains.