USD/CAD flattens as markets weigh US fresh tariff threats
- USD/CAD turns cautious ahead of Tuesday's inflation data for both the US and Canada.
- Traders digest the strong Canadian employment report from Friday and rising tariff threats from the US.
- The first psychological resistance for USD/CAD is seen at 1.3700.

The USD/CAD pair is trading flat on Monday as traders digest US tariff threats against the EU and Mexico and look ahead to the release of inflation data on Tuesday.
At the time of writing, the US Dollar is trading at around 1.3690 against the Canadian Dollar, with the recent 30% threat against goods imported to the US from the European Union and Mexico driving risk sentiment.
Markets remain cautious following reports of potential 35% tariffs on Canadian imports and a steep 50% levy on Copper shipments to the US, which poses a significant threat to one of Canada’s key export sectors.
Despite the negative trade headlines, the Loonie found some support from Friday’s better-than-expected employment report, which showed resilience in Canada’s labor market.
This data has temporarily eased speculation that the Bank of Canada (BoC) might resume rate cuts at its upcoming policy meeting in July. Attention now shifts to Tuesday's Consumer Price Index (CPI) report from Statistics Canada, which will offer more clarity on inflation trends and the central bank’s next move.
Simultaneously, the US will release its own inflation numbers on Tuesday, which are expected to show an annual increase of 3% in the core CPI figure in June.
A hotter US CPI print could strengthen the US Dollar by reviving expectations that the Federal Reserve may keep interest rates higher for longer, further complicating the outlook for the USD/CAD pair.
Technically, USD/CAD is currently retreating after failing to hold above the 78.6% Fibonacci retracement level of the September-February rally at 1.3713.
The pair is testing the 20-day Simple Moving Average (SMA) at 1.3670, while resistance remains firm at the 50-day SMA near 1.3745. Beyond that, the next upside targets are located at the June high of 1.3798 and the 1.3800 psychological level.
The Relative Strength Index (RSI) near 51 indicates neutral momentum, with price action still stuck in a sideways consolidation range.
USD/CAD daily chart
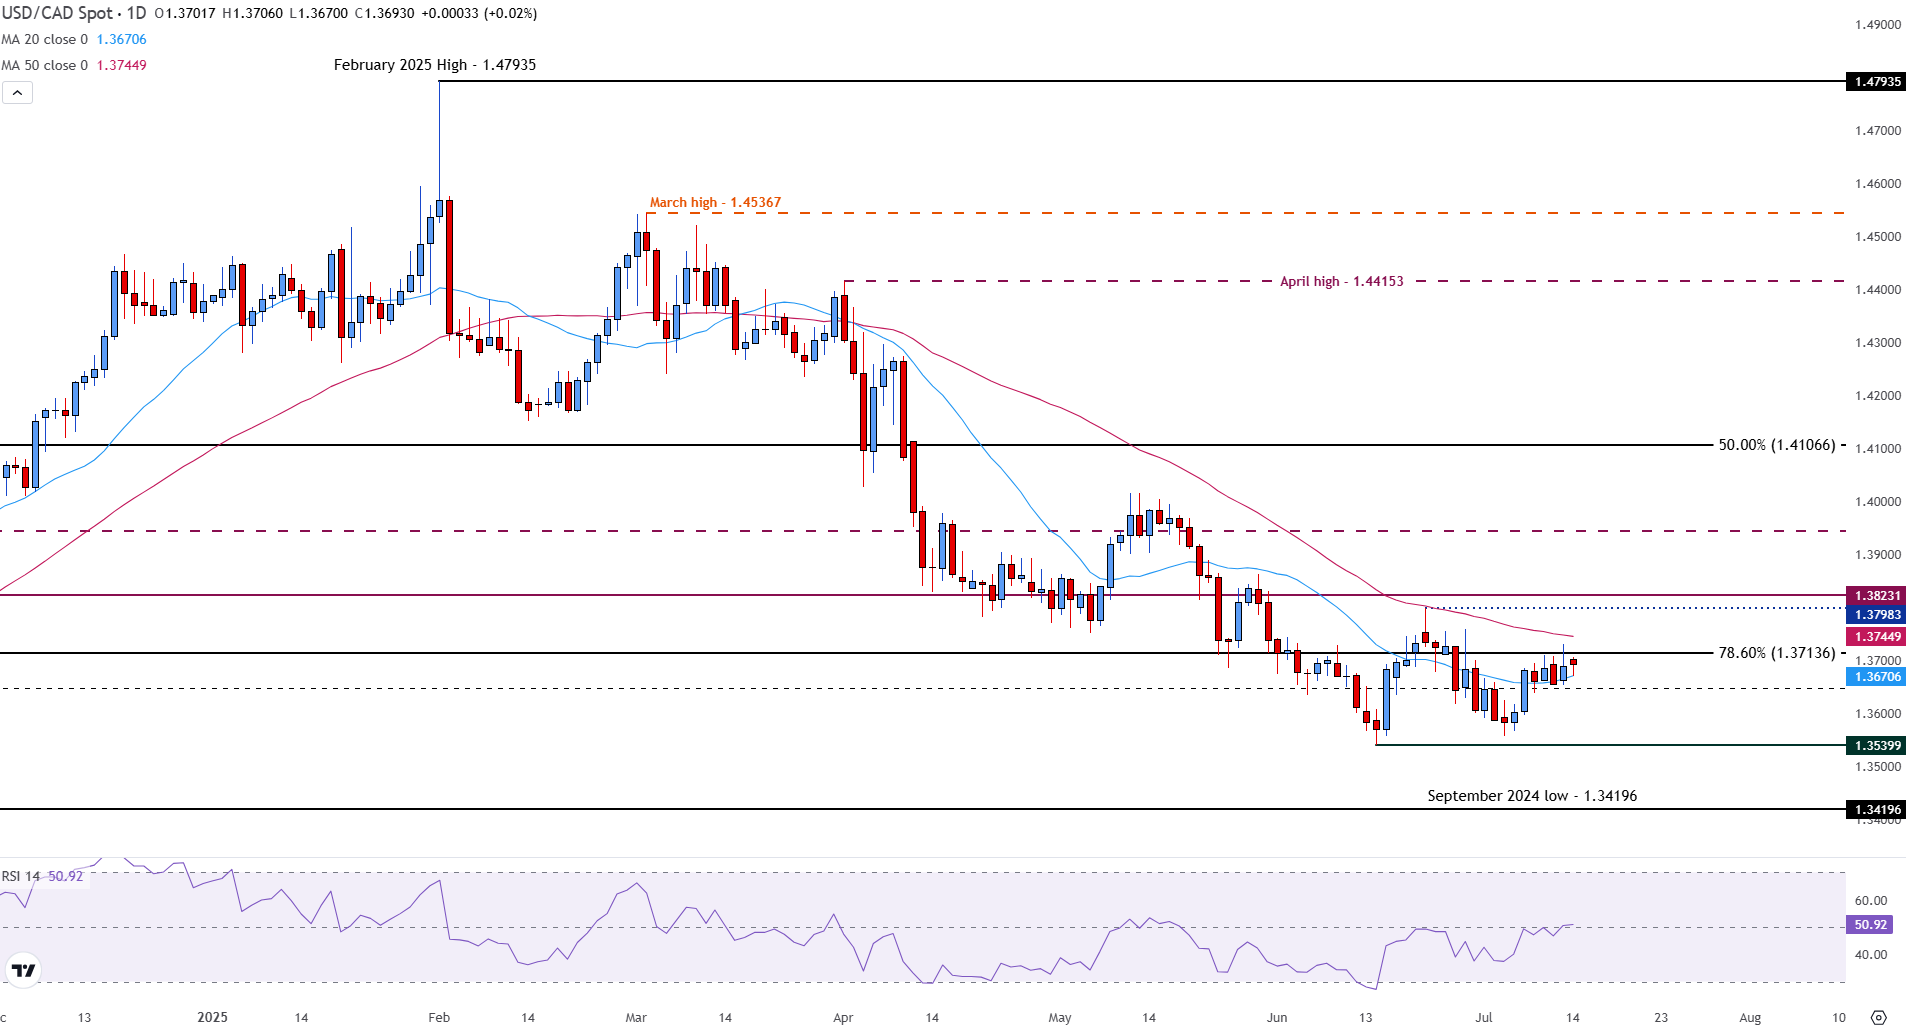
On the downside, a close below the 1.3670 mark could open the door to the June low at 1.3539 and possibly the September 2024 bottom at 1.3419, should bearish sentiment intensify.
Ultimately, Tuesday's inflation readings from both countries could be the deciding factor for the next directional breakout. A stronger Canadian CPI print would likely support the Loonie and drive USD/CAD lower.
Until then, traders should expect range-bound price action and volatility spikes as inflation data looms.
Canadian Dollar FAQs
The key factors driving the Canadian Dollar (CAD) are the level of interest rates set by the Bank of Canada (BoC), the price of Oil, Canada’s largest export, the health of its economy, inflation and the Trade Balance, which is the difference between the value of Canada’s exports versus its imports. Other factors include market sentiment – whether investors are taking on more risky assets (risk-on) or seeking safe-havens (risk-off) – with risk-on being CAD-positive. As its largest trading partner, the health of the US economy is also a key factor influencing the Canadian Dollar.
The Bank of Canada (BoC) has a significant influence on the Canadian Dollar by setting the level of interest rates that banks can lend to one another. This influences the level of interest rates for everyone. The main goal of the BoC is to maintain inflation at 1-3% by adjusting interest rates up or down. Relatively higher interest rates tend to be positive for the CAD. The Bank of Canada can also use quantitative easing and tightening to influence credit conditions, with the former CAD-negative and the latter CAD-positive.
The price of Oil is a key factor impacting the value of the Canadian Dollar. Petroleum is Canada’s biggest export, so Oil price tends to have an immediate impact on the CAD value. Generally, if Oil price rises CAD also goes up, as aggregate demand for the currency increases. The opposite is the case if the price of Oil falls. Higher Oil prices also tend to result in a greater likelihood of a positive Trade Balance, which is also supportive of the CAD.
While inflation had always traditionally been thought of as a negative factor for a currency since it lowers the value of money, the opposite has actually been the case in modern times with the relaxation of cross-border capital controls. Higher inflation tends to lead central banks to put up interest rates which attracts more capital inflows from global investors seeking a lucrative place to keep their money. This increases demand for the local currency, which in Canada’s case is the Canadian Dollar.
Macroeconomic data releases gauge the health of the economy and can have an impact on the Canadian Dollar. Indicators such as GDP, Manufacturing and Services PMIs, employment, and consumer sentiment surveys can all influence the direction of the CAD. A strong economy is good for the Canadian Dollar. Not only does it attract more foreign investment but it may encourage the Bank of Canada to put up interest rates, leading to a stronger currency. If economic data is weak, however, the CAD is likely to fall.
Author

Tammy Da Costa, CFTe®
FXStreet
Tammy is an economist and market analyst with a deep passion for financial markets, particularly commodities and geopolitics.


