Crypto Today: Bitcoin, Ethereum advance while XRP lags amid US-Iran deal optimism
- Bitcoin maintains a short-term recovery bias near $64,000 as Trump says talks with Iran are “moving along very nicely.”
- Ethereum stabilizes above the 50-day EMA as crypto sentiment improves only marginally.
- XRP corrects for a third consecutive day, weighed by a weakening technical structure and momentum indicators.

Bitcoin (BTC) hovers near $64,000 at the time of writing on Wednesday, buoyed by a marginal improvement in crypto sentiment amid growing optimism that the United States (US) and Iran could potentially reach an agreement to open the Strait of Hormuz this week.
Ethereum (ETH) mirrors Bitcoin’s neutral-to-bullish outlook, trading toward $1,900. However, Ripple (XRP) showcases structural weakness, falling for three straight days to trade around $1.07.
Trump eyes potential deal with Iran
US President Donald Trump told reporters on Tuesday that negotiations with Iran are “moving along very nicely,” while adding that more information would be released in 48 hours.
“Could happen. Tomorrow or the next day. A lot of progress has been made,” Trump said while responding to an inquiry about an Axios report that the US is aiming to announce an agreement with Iran over the reopening of the Strait of Hormuz, according to ABC News.
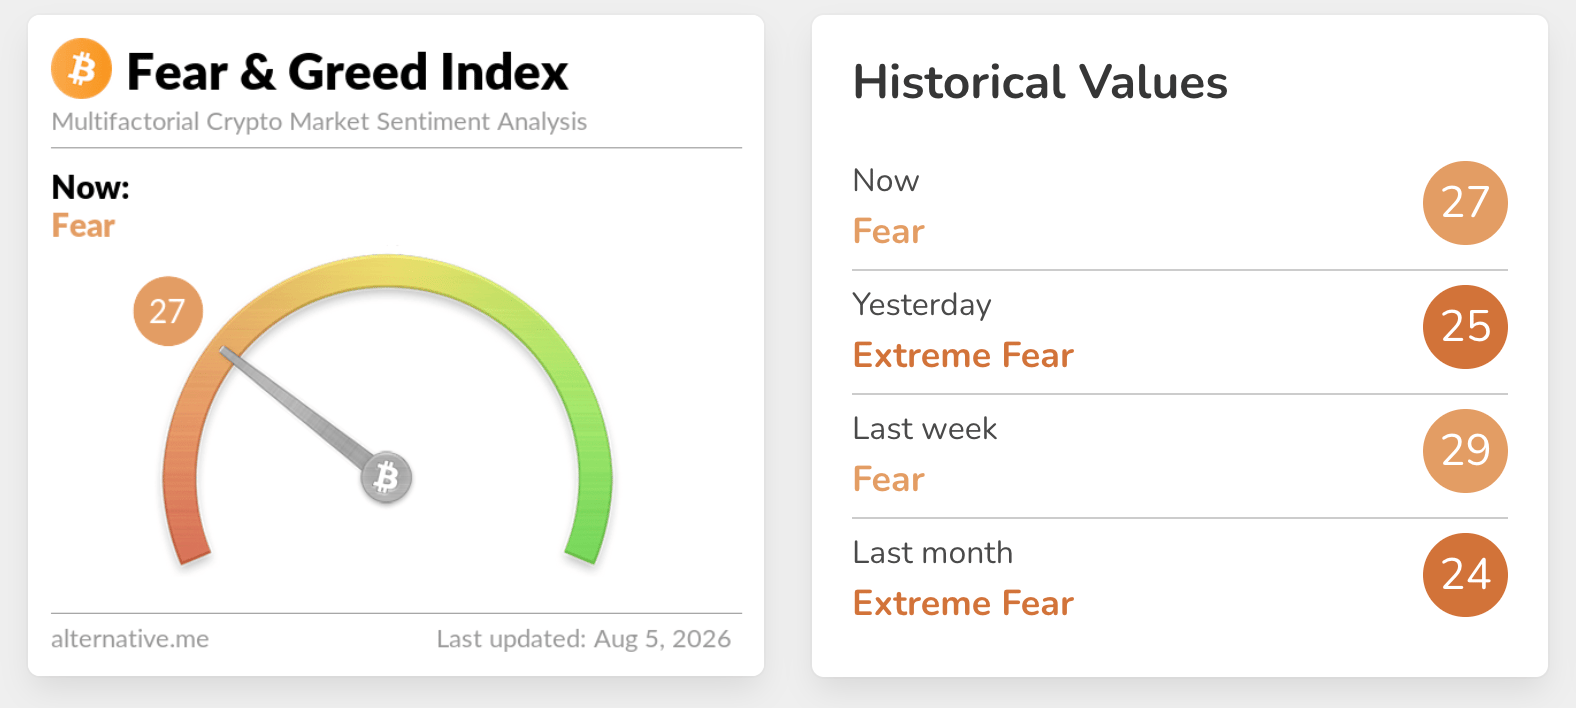
Meanwhile, the crypto market sentiment has improved but only marginally to 28 in Fear territory on Wednesday, from 25 in the Extreme Fear region the day before, according to the Fear & Greed Index. This shows that investors are watching the developments in the Middle East, and that an agreement to reopen the Hormuz Strait could boost risk appetite.
Technical analysis: Bitcoin rebound builds on support
Bitcoin trades near $64,000 with a bearish near-term bias, as price holds beneath the key Exponential Moving Averages (EMAs). The pair is capped by the 50-day EMA at $64,656 and a downward resistance trendline whose break level sits near $64,578, while the 100-day and 200-day EMAs at $67,132 and $72,676 reinforce a broader topside supply zone.
Momentum remains soft, with the Relative Strength Index (RSI) hovering around the neutral 50 mark and the Moving Average Convergence Divergence (MACD) in negative territory, hinting that rallies are still vulnerable to selling pressure.
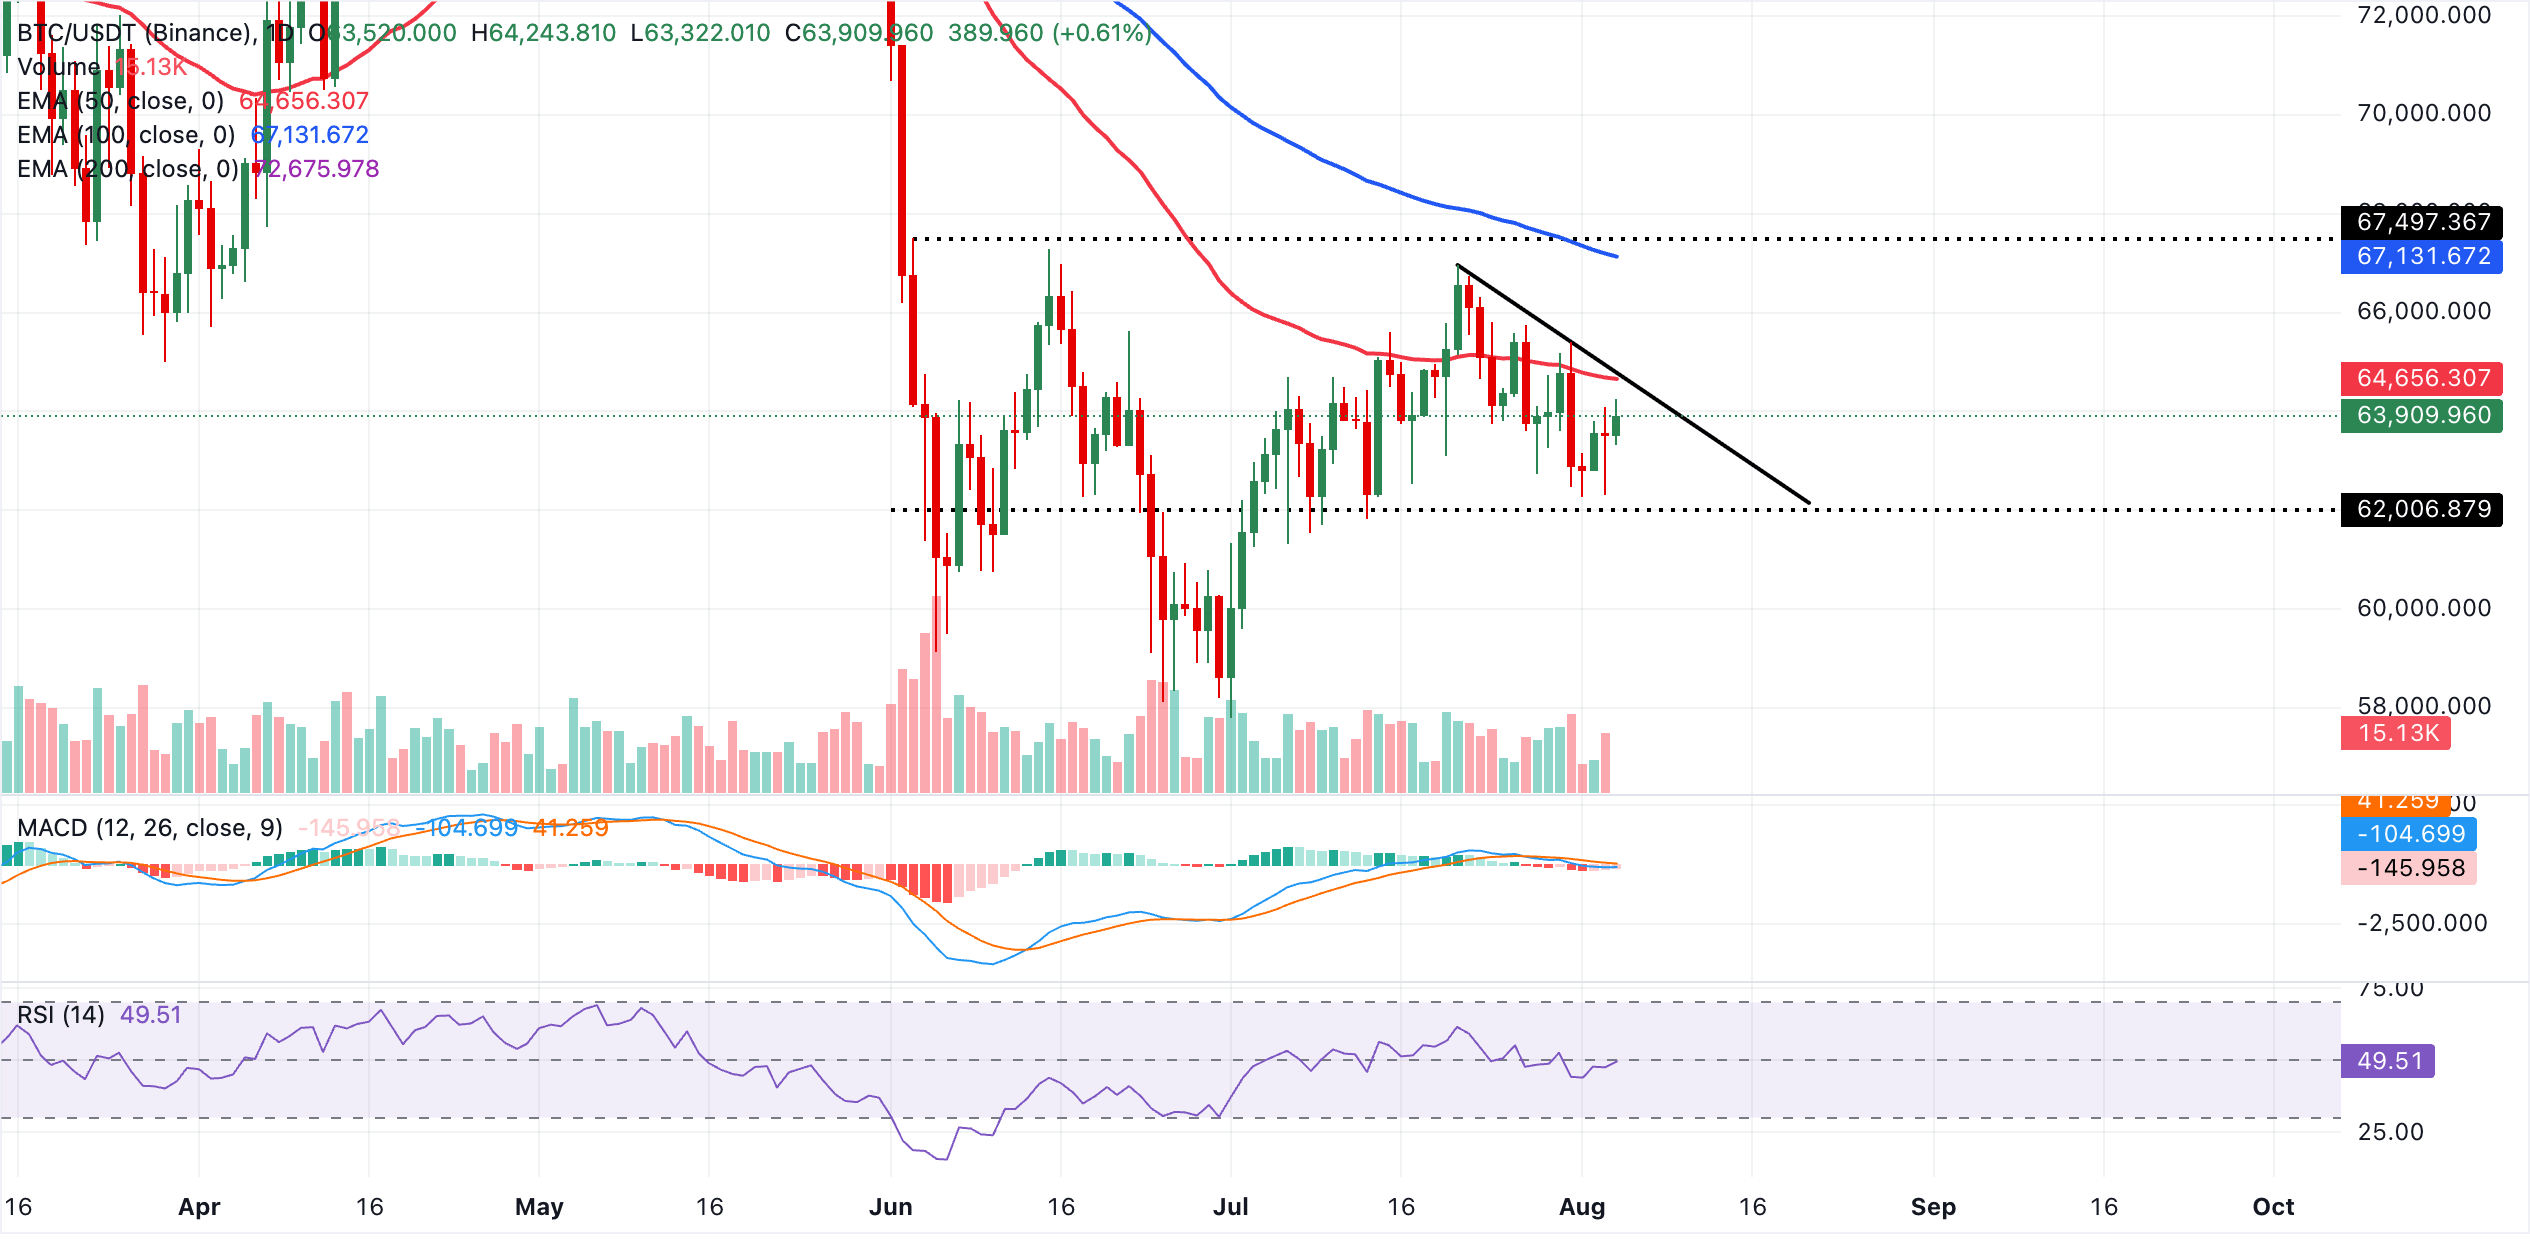
Immediate resistance is seen first at the downward trendline break level around $64,578, followed closely by the 50-day EMA at $64,656, forming a nearby supply cluster. Further up, the 100-day EMA at $67,132 and the 200-day EMA near $72,676 mark successive barriers that would need to be reclaimed to alleviate the prevailing bearish tone and open the way for a more sustained recovery. Any dips toward recent lows would likely rely on intraday demand rather than well-defined daily chart floors.
Altcoins technical outlook: Ethereum builds momentum as XRP slides
Ethereum trades at $1,871 and holds above the 50-day EMA at $1,852 while the ascending trendline support near $1,849 keeps a modestly constructive short-term tone. The RSI around 52 suggests neutral to slightly positive momentum, while the negative MACD reading hints that upside traction remains fragile as long as price stays under the higher daily EMAs.
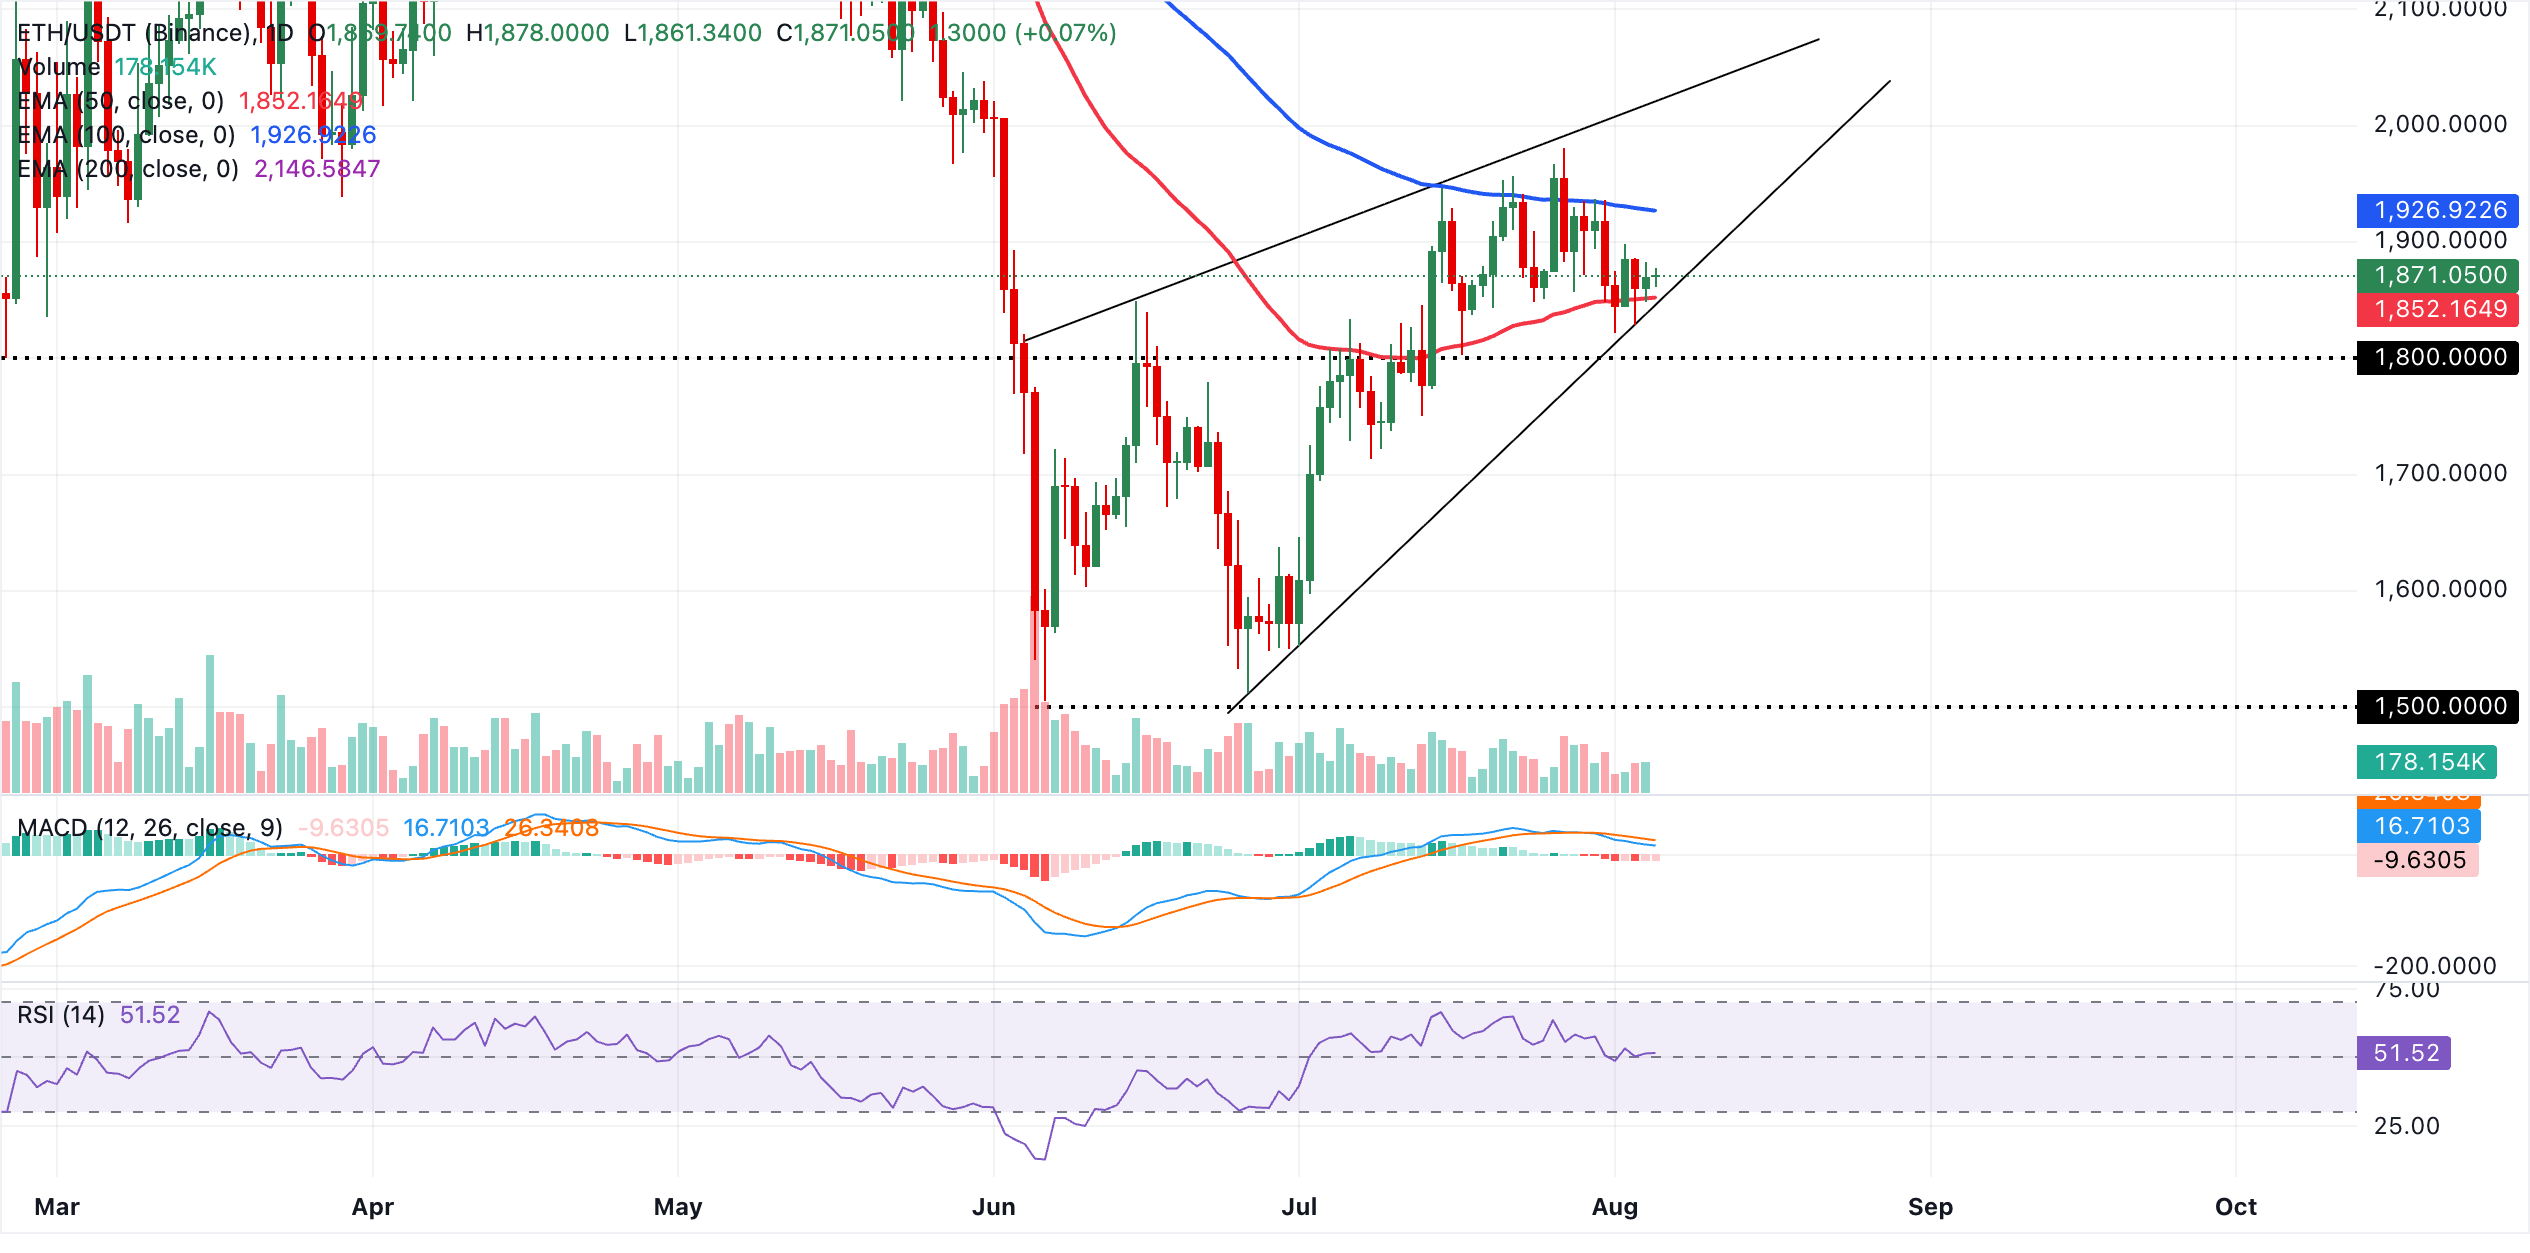
Initial resistance lies at the 100-day EMA near $1,927, with a more significant barrier at the 200-day EMA at $2,147, where a sustained break would be needed to strengthen the broader bullish outlook. On the downside, immediate support is seen around the 50-day EMA at $1,852, reinforced by the rising trendline support near $1,849. A daily close below this confluence would expose the pair to a deeper pullback and undermine the current constructive bias.
XRP, on the other hand, trades around $1.07, maintaining a bearish stance as the price holds well below the 50-day, 100-day, and 200-day EMAs clustered from roughly $1.12 to $1.40. The persistent rejection from the broader downtrend resistance line keeps the pair entrenched in a medium-term decline, while the RSI at 43 leans mildly bearish without yet signaling oversold conditions.
The MACD indicator has slipped marginally into negative territory, hinting that downside momentum remains in control even though selling pressure is not accelerating aggressively.
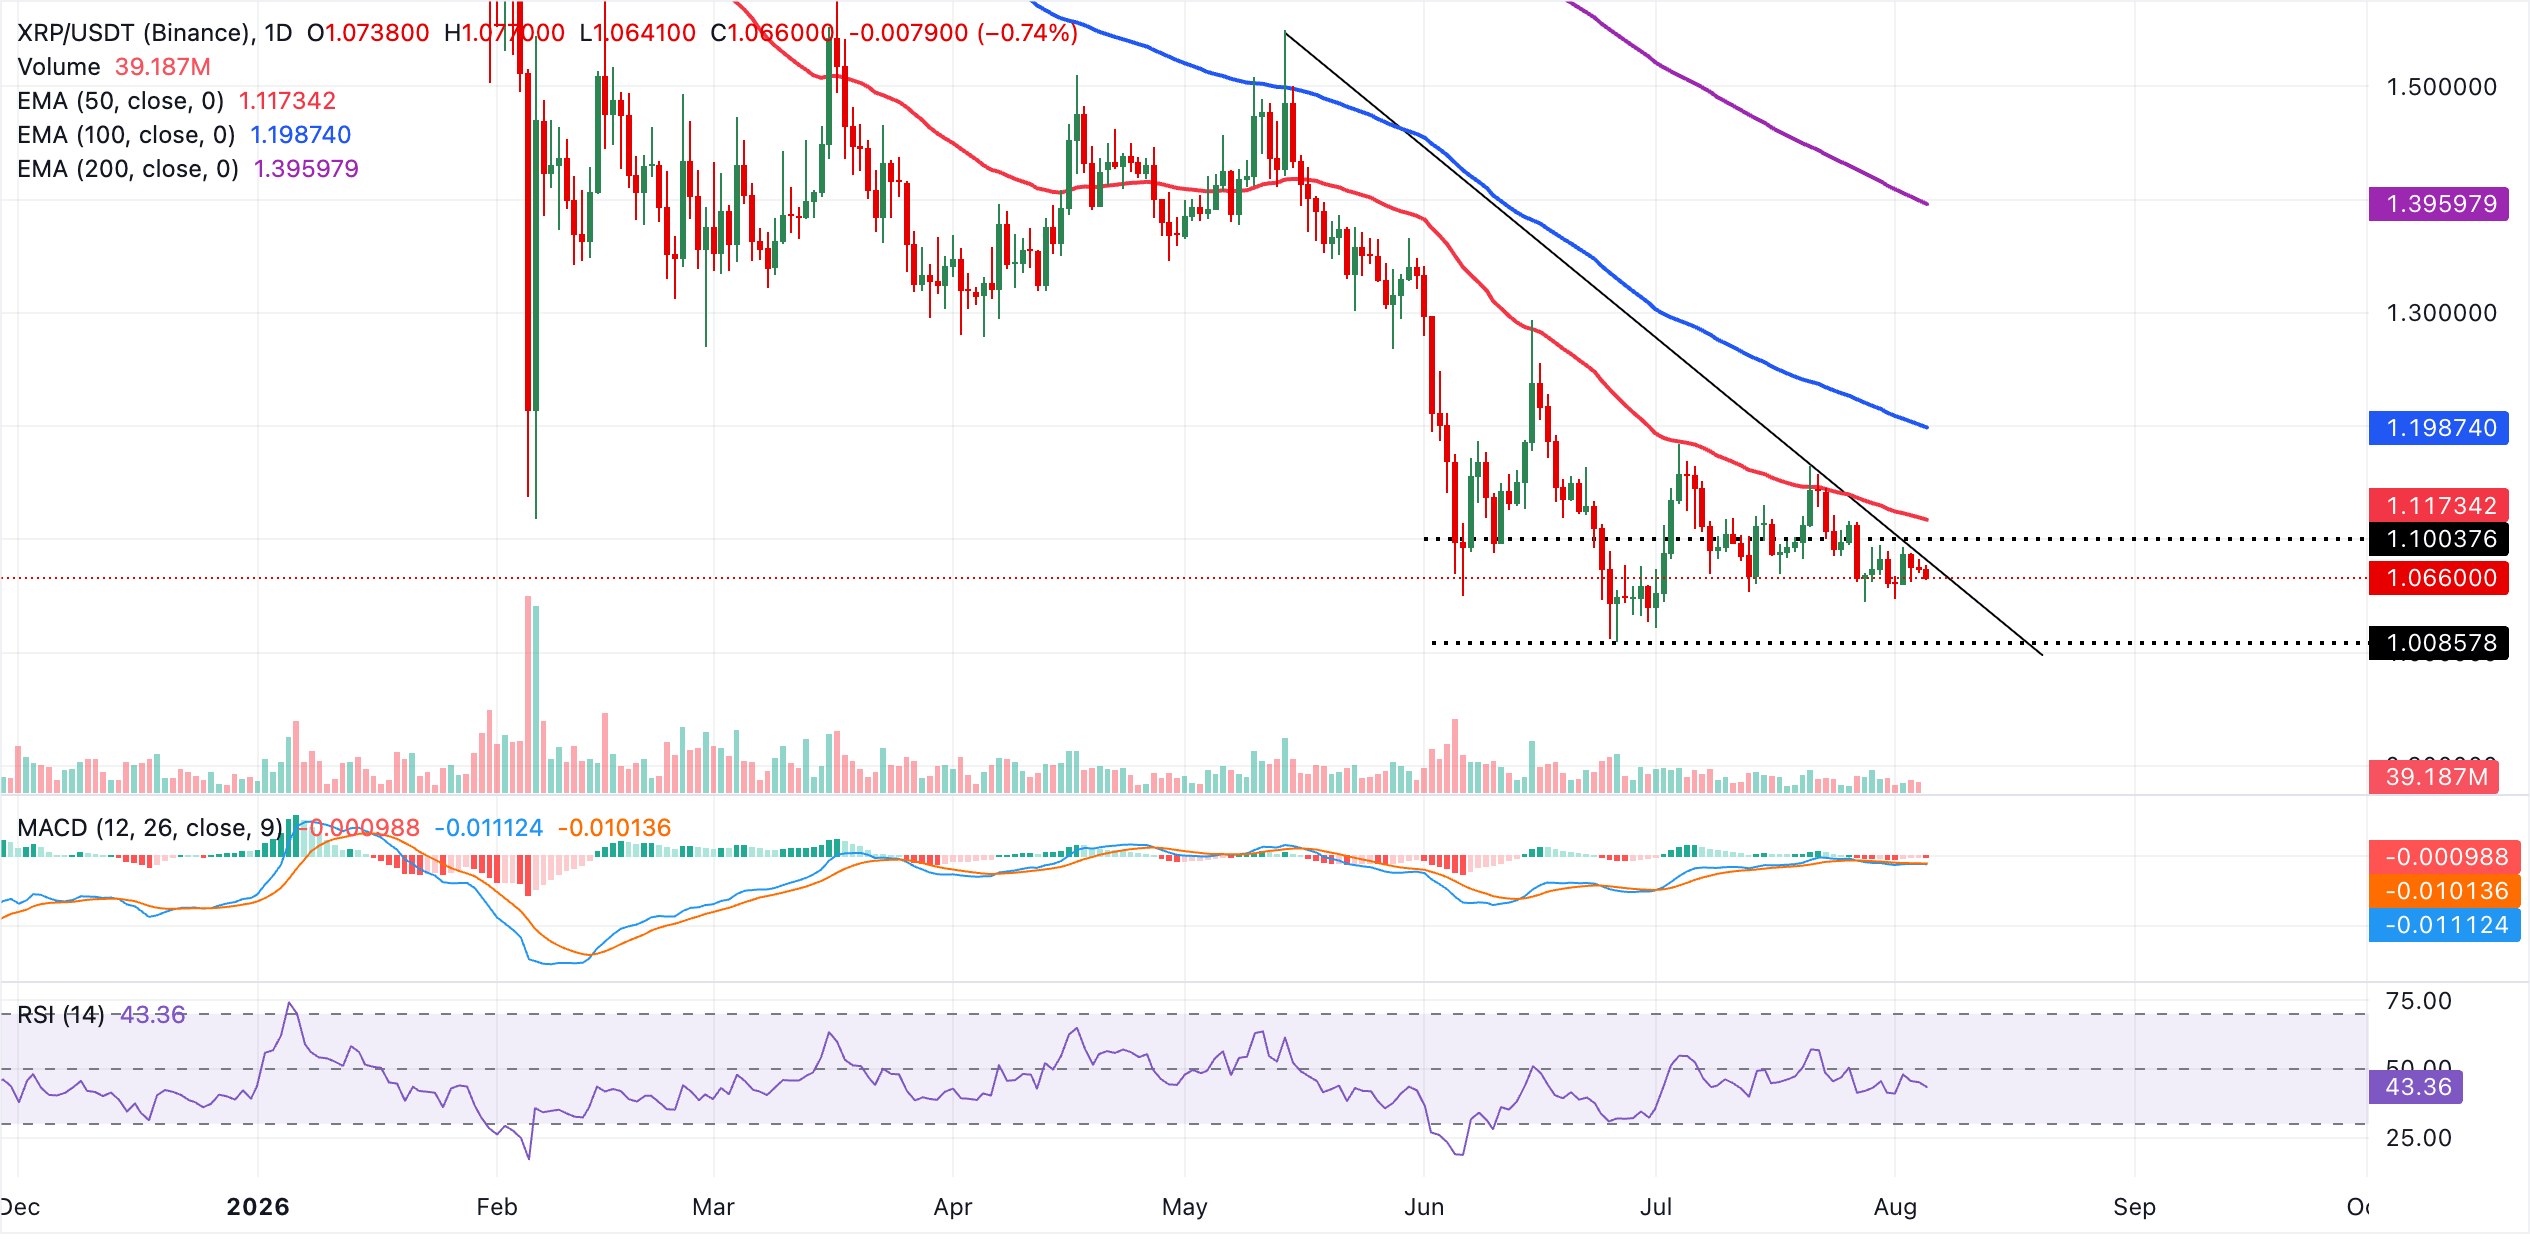
Initial resistance lies at the 50-day EMA around $1.12, with further barriers at the 100-day EMA near $1.20 and the 200-day EMA close to $1.40, where the broader downtrend line also exerts structural pressure. On the downside, the lack of clearly defined structural levels on the daily chart leaves the immediate focus on psychological levels at $1.05 and $1.00.
(The technical analysis of this story was written with the help of an AI tool. Know more.)
Cryptocurrency prices FAQs
Token launches influence demand and adoption among market participants. Listings on crypto exchanges deepen the liquidity for an asset and add new participants to an asset’s network. This is typically bullish for a digital asset.
A hack is an event in which an attacker captures a large volume of the asset from a DeFi bridge or hot wallet of an exchange or any other crypto platform via exploits, bugs or other methods. The exploiter then transfers these tokens out of the exchange platforms to ultimately sell or swap the assets for other cryptocurrencies or stablecoins. Such events often involve an en masse panic triggering a sell-off in the affected assets.
Macroeconomic events like the US Federal Reserve’s decision on interest rates influence crypto assets mainly through the direct impact they have on the US Dollar. An increase in interest rate typically negatively influences Bitcoin and altcoin prices, and vice versa. If the US Dollar index declines, risk assets and associated leverage for trading gets cheaper, in turn driving crypto prices higher.
Halvings are typically considered bullish events as they slash the block reward in half for miners, constricting the supply of the asset. At consistent demand if the supply reduces, the asset’s price climbs.
Author

John Isige
FXStreet
John Isige is a seasoned cryptocurrency journalist and markets analyst committed to delivering high-quality, actionable insights tailored to traders, investors, and crypto enthusiasts. He enjoys deep dives into emerging Web3 tren



