Breaking: US ISM Manufacturing PMI rises to 55.6 in July vs. 54 expected

Business activity in the US manufacturing sector expanded at an accelerating pace in July, with the Institute for Supply Management's (ISM) Manufacturing Purchasing Managers' Index (PMI) rising to 55.6 from 53.3 in June. This reading came in better than the market expectation of 54.
Other details of the publication showed that the sector's payrolls grew in July, with the Employment Index climbing to 52.8 from 49.7. In this period, the Prices Paid Index, the survey's inflation component, edged lower to 71.1 from 73 but came in above the market forecast of 70.3.
Assessing the report's findings, “In July, US manufacturing activity remained in expansion territory, growing at its fastest rate in more than four years," noted Susan Spence, MBA, Chair of the Institute for Supply Management Manufacturing Business Survey Committee.
"Of the five subindexes that make up the PMI, four grew faster compared to the previous month; the exception was the Inventories Index, which was down just 0.2 percentage point," Spence added.
Market reaction to US ISM Manufacturing PMI data
The US Dollar (USD) Index edged slightly higher with the immediate reaction to the PMI report and was last seen trading flat on the day at 99.82.
US Dollar Price Last 7 Days
The table below shows the percentage change of US Dollar (USD) against listed major currencies last 7 days. US Dollar was the weakest against the Japanese Yen.
| USD | EUR | GBP | JPY | CAD | AUD | NZD | CHF | |
|---|---|---|---|---|---|---|---|---|
| USD | -1.09% | -0.88% | -4.38% | -0.35% | 0.09% | -1.06% | -0.83% | |
| EUR | 1.09% | 0.20% | -3.32% | 0.75% | 1.20% | 0.04% | 0.25% | |
| GBP | 0.88% | -0.20% | -3.62% | 0.55% | 1.02% | -0.16% | 0.06% | |
| JPY | 4.38% | 3.32% | 3.62% | 4.18% | 4.65% | 3.45% | 3.60% | |
| CAD | 0.35% | -0.75% | -0.55% | -4.18% | 0.42% | -0.70% | -0.49% | |
| AUD | -0.09% | -1.20% | -1.02% | -4.65% | -0.42% | -1.15% | -0.93% | |
| NZD | 1.06% | -0.04% | 0.16% | -3.45% | 0.70% | 1.15% | 0.22% | |
| CHF | 0.83% | -0.25% | -0.06% | -3.60% | 0.49% | 0.93% | -0.22% |
The heat map shows percentage changes of major currencies against each other. The base currency is picked from the left column, while the quote currency is picked from the top row. For example, if you pick the US Dollar from the left column and move along the horizontal line to the Japanese Yen, the percentage change displayed in the box will represent USD (base)/JPY (quote).
This section below was published as a preview of the US ISM Manufacturing PMI report for July.
- The US ISM Manufacturing PMI is seen improving to 54 in July from 53.3 in June.
- The ISM Prices Paid component is expected to have eased for the third consecutive month.
- The US Dollar trades at seven-week lows against the Euro, weighed by a positive risk sentiment.
Investors are attentive to the US Institute for Supply Management (ISM) on Monday, as it releases July’s Manufacturing Purchasing Managers Index (PMI). This is one of the most closely followed indicators of business activity in the US manufacturing sector, considered a key indicator for economic growth.
The market consensus anticipates an improvement to 54 in the headline indicator, from the 53.3 reading seen in June. If these figures are confirmed, they would match May’s reading, which was the strongest performance of the last four years, in an index showing expansion at levels above 50 and contraction otherwise.
Apart from that, the US ISM Prices Paid component is expected to have eased to 70.3, from 73 in June and 82.1 in May. This is the lowest inflation reading since the war between the US and Iran started, back in February, but still significantly above the 60 average in the six months preceding the war.
What to expect from the US ISM Manufacturing PMI report?
If the market consensus is met, it will confirm the resilience of the US manufacturing sector amid uncertainty surrounding the conflict in the Middle East and high energy prices stemming from it.
These figures are likely to revive the rhetoric of US economic exceptionalism and ease concerns about the slowdown of the second quarter’s US Gross Domestic Product (GDP) released last week. The market, however, will be very attentive to the Employment sub-index for a more complete view.
The US ISM Manufacturing Employment Index has been improving in the last two readings, but it has remained within contractionary levels for most of the last four years. In that sense, a strong PMI release, coupled with an expansion in employment and with inflation at relatively high levels, is likely to improve investors’ confidence about the US economy and strengthen the case for some Federal Reserve (Fed) monetary tightening this year, providing some support to the US Dollar.
The positive impact on the Greenback, however, is likely to be limited. The US Dollar Index (DXY), which measures the value of the USD against a basket of currencies, is languishing at seven-week lows amid a mix of risk-appetite triggered by the pause in hostilities in Iran and the sharp USD/JPY reversal following an exceptional US-Japan coordinated FX intervention to shore up the Japanese Yen.
When will the US ISM Manufacturing PMI report be released, and how could it affect EUR/USD?
The US ISM Manufacturing PMI report is scheduled for release at 14:00 GMT on Monday.
The Euro (EUR) consolidates gains on Monday, trading at the 1.1525 area against the US Dollar at the time of writing, standing at its highest levels since mid-June. In that sense, positive data might put a lid on Euro appreciation, but it is unlikely to reverse the current bullish trend unless the risk mood changes substantially
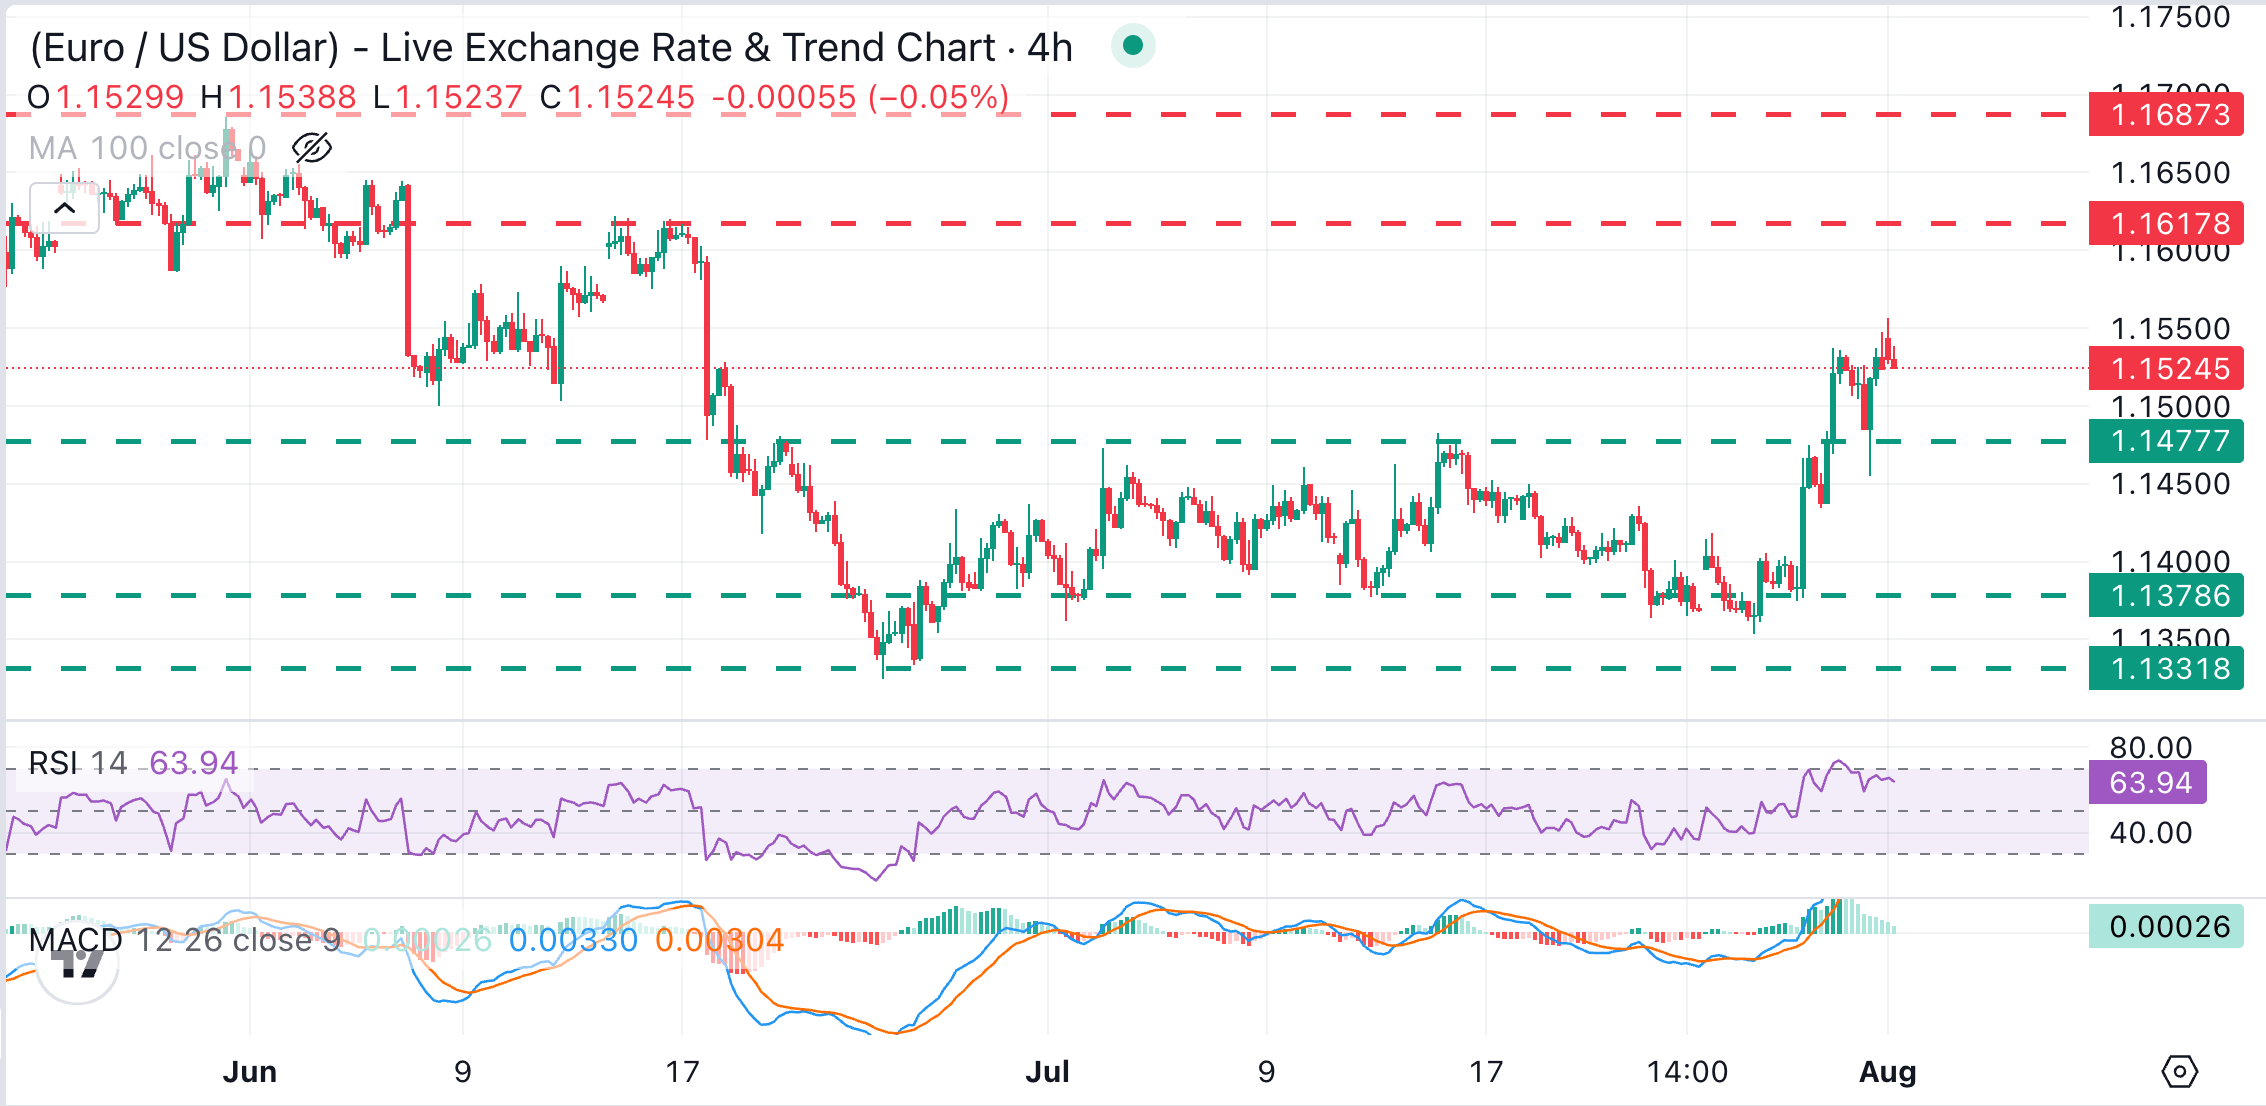
The technical picture shows a modest bullish near-term bias, with the 4-hour Relative Strength Index (14) hovering around 64, showing a positive but not yet overbought momentum, while the Moving Average Convergence Divergence (MACD) indicator remains in positive territory.
Upside attempts have been capped at the 1.1550 area on Monday. Further up, the June 14 and 17 highs, around 1.1620, and the May 29 high, at 1.1685, are likely to test bulls. On the downside, previous resistance around 1.1475 (July 15, 16 highs) has now turned support. If that level gives up, the next targets are the July 29 lows around 1.1375 and the late June lows at 1.1325.
(The technical analysis of this story was written with the help of an AI tool. Know more.)
Economic Indicator
ISM Manufacturing PMI
The Institute for Supply Management (ISM) Manufacturing Purchasing Managers Index (PMI), released on a monthly basis, is a leading indicator gauging business activity in the US manufacturing sector. The indicator is obtained from a survey of manufacturing supply executives based on information they have collected within their respective organizations. Survey responses reflect the change, if any, in the current month compared to the previous month. A reading above 50 indicates that the manufacturing economy is generally expanding, a bullish sign for the US Dollar (USD). A reading below 50 signals that factory activity is generally declining, which is seen as bearish for USD.
Read more.Next release: Mon Aug 03, 2026 14:00
Frequency: Monthly
Consensus: 54
Previous: 53.3
Source: Institute for Supply Management
The Institute for Supply Management’s (ISM) Manufacturing Purchasing Managers Index (PMI) provides a reliable outlook on the state of the US manufacturing sector. A reading above 50 suggests that the business activity expanded during the survey period and vice versa. PMIs are considered to be leading indicators and could signal a shift in the economic cycle. Stronger-than-expected prints usually have a positive impact on the USD. In addition to the headline PMI, the Employment Index and the Prices Paid Index numbers are watched closely as they shine a light on the labour market and inflation.
Economic Indicator
ISM Manufacturing Prices Paid
The Institute for Supply Management (ISM) Manufacturing Index shows business conditions in the US manufacturing sector, taking into account expectations for future production, new orders, inventories, employment and deliveries. It is a significant indicator of the overall economic condition in US. The ISM Prices Paid represents business sentiment regarding future inflation. A high reading is seen as positive for the USD, while a low reading is seen as negative.
Read more.Next release: Mon Aug 03, 2026 14:00
Frequency: Monthly
Consensus: 70.3
Previous: 73
Source: Institute for Supply Management
Author

FXStreet Team
FXStreet
Composed of a group of economic journalists and FX experts, the FXStreet content team produces and oversees all content published on FXStreet. It provides a purely journalistic approach to the Forex market.