Breaking: US GDP is seen expanding by 2.0% YoY in Q1
- US GDP expanded by 2.0% YoY in the January-March period.
- The US Dollar Index trades with decent losses near 98.40.

The US economy is expected to have expanded at an annualised rate of 2.0% in the first quarter of 2026, according to data released Thursday by the Bureau of Economic Analysis (BEA), missing market forecasts, although coming up from the prior 0.5% expansion.
From the BEA’s release: “The contributors to the increase in real GDP in the first quarter were investment, exports, consumer spending, and government spending. Imports, which are a subtraction in the calculation of GDP, also increased.”
Market reaction
Following the disappointing data, the US Dollar Index (DXY) remains in negative territory, hovering above the 98.40 region in the wake of the release.
US Dollar Price Today
The table below shows the percentage change of US Dollar (USD) against listed major currencies today. US Dollar was the strongest against the Canadian Dollar.
| USD | EUR | GBP | JPY | CAD | AUD | NZD | CHF | |
|---|---|---|---|---|---|---|---|---|
| USD | -0.16% | -0.25% | -2.27% | -0.10% | -0.43% | -0.61% | -0.91% | |
| EUR | 0.16% | -0.05% | -2.11% | 0.06% | -0.25% | -0.44% | -0.72% | |
| GBP | 0.25% | 0.05% | -2.03% | 0.12% | -0.18% | -0.37% | -0.67% | |
| JPY | 2.27% | 2.11% | 2.03% | 2.19% | 1.88% | 1.64% | 1.35% | |
| CAD | 0.10% | -0.06% | -0.12% | -2.19% | -0.33% | -0.53% | -0.81% | |
| AUD | 0.43% | 0.25% | 0.18% | -1.88% | 0.33% | -0.18% | -0.46% | |
| NZD | 0.61% | 0.44% | 0.37% | -1.64% | 0.53% | 0.18% | -0.30% | |
| CHF | 0.91% | 0.72% | 0.67% | -1.35% | 0.81% | 0.46% | 0.30% |
The heat map shows percentage changes of major currencies against each other. The base currency is picked from the left column, while the quote currency is picked from the top row. For example, if you pick the US Dollar from the left column and move along the horizontal line to the Japanese Yen, the percentage change displayed in the box will represent USD (base)/JPY (quote).
This section below was published as a preview of the preliminary US GDP for the first quarter at 11:00 GMT.
- The United States Gross Domestic Product is seen expanding at an annualised rate of 2.3% in Q1.
- Investors will focus on the potential impact of the US-Iran conflict on the economy.
- The US Dollar remains in recovery mode following April lows.
The United States (US) Bureau of Economic Analysis (BEA) is set to publish its preliminary estimate of first-quarter Gross Domestic Product (GDP) on Thursday, with analysts expecting the data to show annualised growth at a solid 2.3%, a sharp rebound from the meagre 0.5% expansion recorded in the final quarter of 2025.

Markets brace for US growth data amid geopolitical woes…and a new Fed?
Investors are anxious ahead of Thursday's release of the US preliminary GDP figures for the January-March period, which is generally seen as the most market-moving estimate of the three issued each quarter. Beyond headline growth, the report also includes fresh Personal Consumption Expenditures (PCE) data, the Federal Reserve’s (Fed) preferred inflation gauge.
This quarter’s numbers are especially important, as market participants will look for early signs, if any at all, of the ongoing crisis in the Middle East, as well as delayed effects from Trump’s tariffs, all with the broader White House administration policies at the centre of the debate.
The release follows the Fed’s April 28-29 meeting, where the Committee delivered a widely anticipated “on hold” decision on the Fed Funds Target Range (FFTR).
Also included in the report is the GDP Price Index, commonly called the GDP deflator, which measures inflation across all domestically produced goods and services, including exports but excluding imports. These data will become more prominent amid the ongoing US-Iran conflict and its clear impact on crude Oil prices.
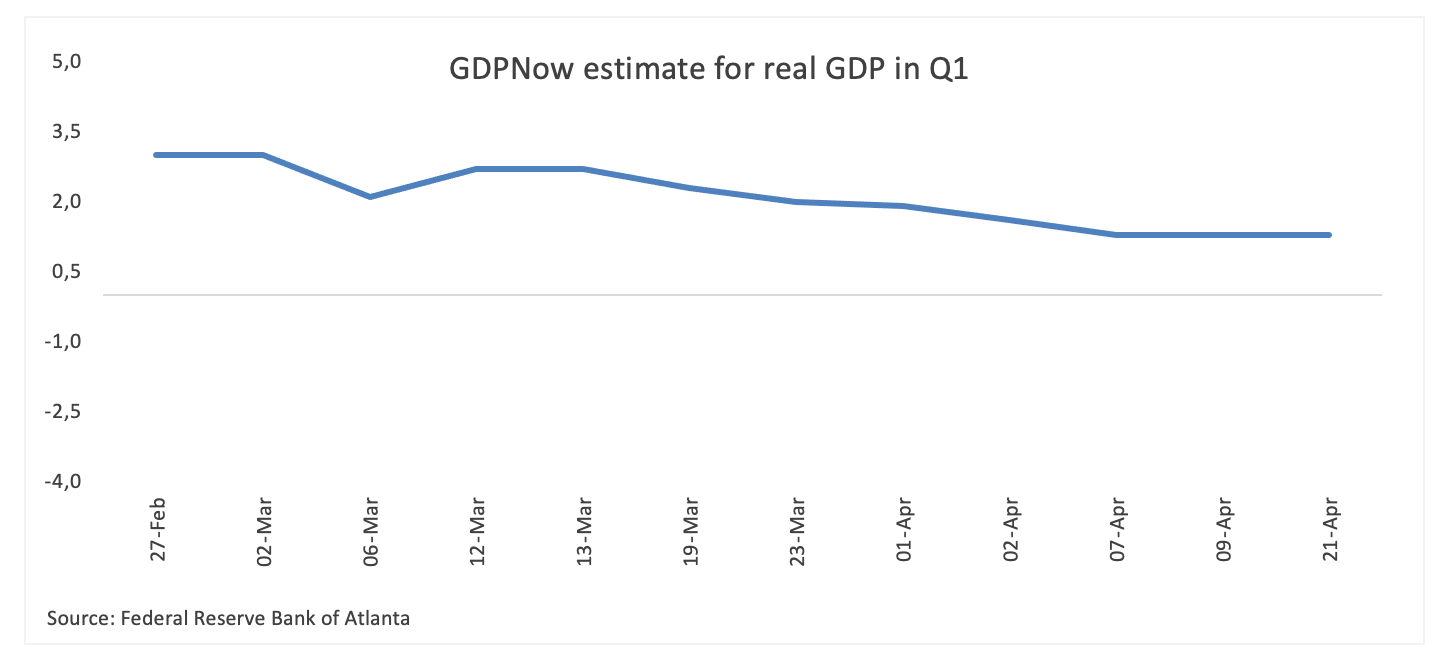
The Atlanta Fed’s GDPNow model, closely watched for its real-time tracking of economic activity, forecast a 1.2% expansion in Q1 GDP as of its April 21 update (from 1.3% set on April 9).
When will the GDP print be released, and how can it affect the US Dollar Index?
The US GDP report, due at 12:30 GMT on Thursday, could prove pivotal for the US Dollar (USD) in case of a big surprise in either direction, as markets remain almost exclusively focused on developments from the Middle East. Alongside the headline growth figure, markets will scrutinise updates to the GDP Price Index and the Q1 Personal Consumption Expenditures (PCE) Price Index, key data points that could shift expectations for Federal Reserve policy and the Greenback’s direction.
A stronger-than-expected GDP print may temporarily ease fears of a stagflationary environment, potentially offering a tailwind for the current recovery of the buck.
The broader technical outlook for the US Dollar Index (DXY) remains slightly constructive amid the ongoing consolidative price action. The index is trading near its 200-day SMA at 98.53 and below its 200-week SMA at 103.13.
Downside levels remain in focus, with support eyed at 97.63 – April’s low. Any upside correction could first target the 2026 ceiling at 100.63 seen in late March, seconded by the March 2025 high of 104.68.
Momentum indicators lean bearish, with the Relative Strength Index (RSI) on the daily chart near 47 and the Average Directional Index (ADX) just below 23, suggesting fading strength behind the recent upward move.
(This story was corrected on April 30 at 10:32 GMT to say that data is expected to show a sharp rebound from the meagre 0.5% expansion recorded in the final quarter of 2025, not of 2024.)
Economic Indicator
Core Personal Consumption Expenditures - Price Index (YoY)
The Core Personal Consumption Expenditures (PCE), released by the US Bureau of Economic Analysis on a monthly basis, measures the changes in the prices of goods and services purchased by consumers in the United States (US). The PCE Price Index is also the Federal Reserve’s (Fed) preferred gauge of inflation. The YoY reading compares the prices of goods in the reference month to the same month a year earlier. The core reading excludes the so-called more volatile food and energy components to give a more accurate measurement of price pressures." Generally, a high reading is bullish for the US Dollar (USD), while a low reading is bearish.
Read more.Next release: Thu Apr 30, 2026 12:30
Frequency: Monthly
Consensus: 3.2%
Previous: 3%
Source: US Bureau of Economic Analysis
After publishing the GDP report, the US Bureau of Economic Analysis releases the Personal Consumption Expenditures (PCE) Price Index data alongside the monthly changes in Personal Spending and Personal Income. FOMC policymakers use the annual Core PCE Price Index, which excludes volatile food and energy prices, as their primary gauge of inflation. A stronger-than-expected reading could help the USD outperform its rivals as it would hint at a possible hawkish shift in the Fed’s forward guidance and vice versa.
Economic Indicator
Gross Domestic Product Price Index
The Gross Domestic Product (GDP) Price Index, released quarterly by the Bureau of Economic Analysis, measures the change in the prices of goods and services produced in the United States. The prices that Americans pay for imports aren’t included. Changes in the GDP price index are followed as an indicator of inflationary pressures, which may anticipate higher interest rates. A high reading is seen as bullish for the US Dollar (USD), while a low reading is seen as bearish.
Read more.Next release: Thu Apr 30, 2026 12:30 (Prel)
Frequency: Quarterly
Consensus: -
Previous: 3.7%
Source: US Bureau of Economic Analysis
Author

FXStreet Team
FXStreet
Composed of a group of economic journalists and FX experts, the FXStreet content team produces and oversees all content published on FXStreet. It provides a purely journalistic approach to the Forex market.

















