US Dollar Index Price Forecast: 101.80 remains key support zone ahead of FOMC minutes
- The US Dollar reflects strength ahead of the FOMC minutes release later in the day.
- Fed officials have signaled no urgency for another interest rate hike.
- Oil prices bounce back amid fears of storm hitting US energy capacity.


The US Dollar (USD) trades higher against its major peers ahead of the release of Federal Open Market Committee (FOMC) minutes of the September policy meeting at 18:00 GMT.
US Dollar Price Today
The table below shows the percentage change of US Dollar (USD) against listed major currencies today. US Dollar was the strongest against the New Zealand Dollar.
| USD | EUR | GBP | JPY | CAD | AUD | NZD | CHF | |
|---|---|---|---|---|---|---|---|---|
| USD | 0.31% | 0.22% | 0.17% | 0.11% | 0.22% | 0.34% | 0.19% | |
| EUR | -0.31% | -0.09% | -0.12% | -0.20% | -0.08% | 0.02% | -0.13% | |
| GBP | -0.22% | 0.09% | -0.04% | -0.09% | -0.00% | 0.13% | -0.01% | |
| JPY | -0.17% | 0.12% | 0.04% | -0.07% | 0.05% | 0.16% | 0.02% | |
| CAD | -0.11% | 0.20% | 0.09% | 0.07% | 0.11% | 0.24% | 0.10% | |
| AUD | -0.22% | 0.08% | 0.00% | -0.05% | -0.11% | 0.13% | -0.02% | |
| NZD | -0.34% | -0.02% | -0.13% | -0.16% | -0.24% | -0.13% | -0.13% | |
| CHF | -0.19% | 0.13% | 0.01% | -0.02% | -0.10% | 0.02% | 0.13% |
The heat map shows percentage changes of major currencies against each other. The base currency is picked from the left column, while the quote currency is picked from the top row. For example, if you pick the US Dollar from the left column and move along the horizontal line to the Japanese Yen, the percentage change displayed in the box will represent USD (base)/JPY (quote).
In the early European trade, the US Dollar Index (DXY), which gauges the Greenback’s value against six major currencies, trades 0.22% higher at around 102.07.
Investors will pay close attention to FOMC minutes to get fresh cues regarding the Federal Reserve’s (Fed) monetary policy outlook.
Lately, Fed board members have signaled that there is no urgency for another interest rate hike, but have maintained a hawkish stance on the outlook.
On the global front, oil prices have shown some signs of recovery after remaining under pressure in over two weeks. The WTI Oil price has rebounded as fears of storm hitting energy production in the United States (US) have renewed oil supply fears.
US forecasters said on Tuesday a storm forming in the Gulf of Mexico would become the first Atlantic hurricane of 2026 within two days and would likely hit oil and gas producing facilities, Reuters report.
Higher energy prices could reinforce fears of global price projections remaining higher, a scenario that could boost hawkish Fed bets.
US Dollar Index Technical Analysis
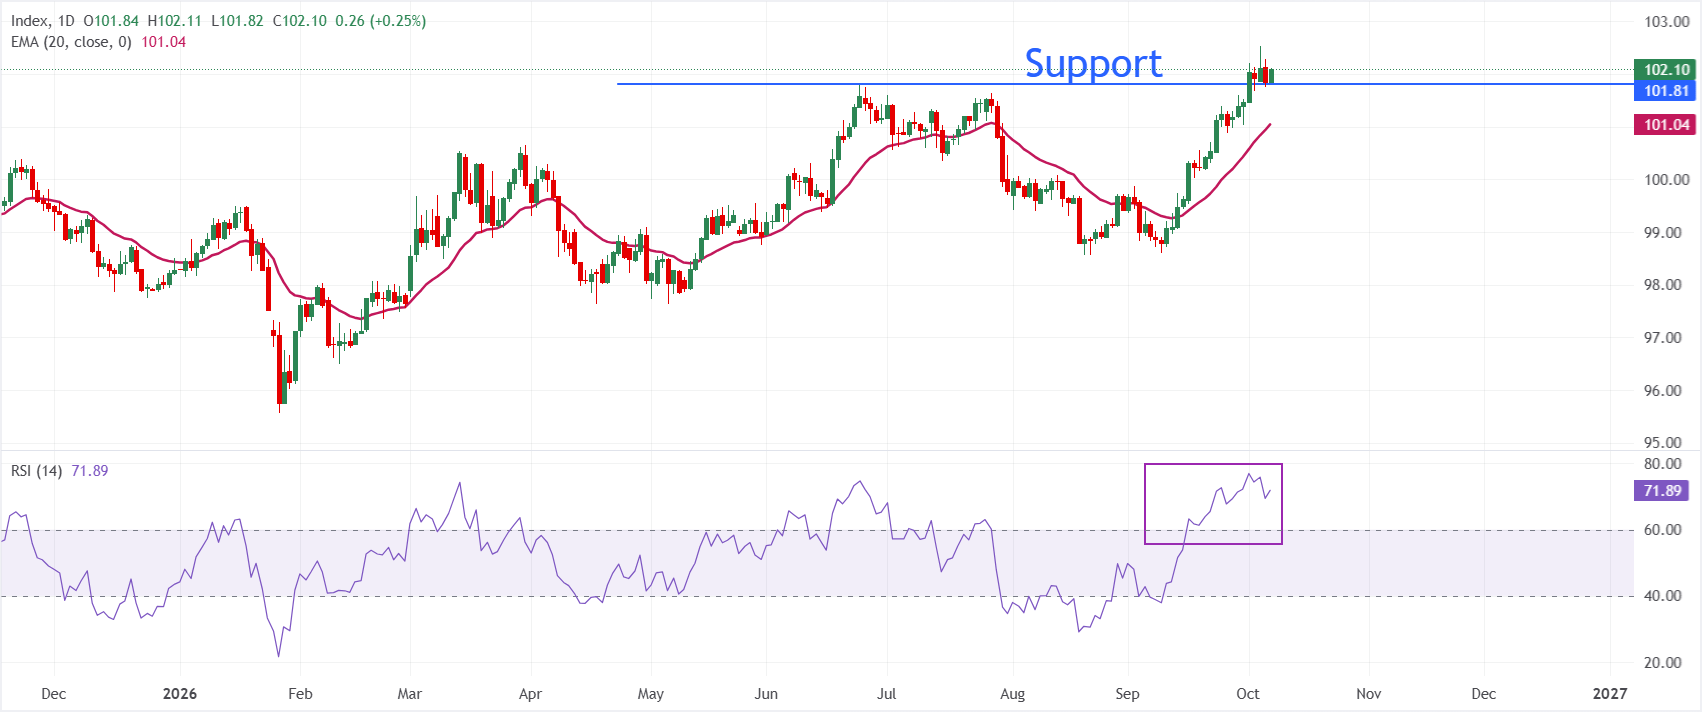
In the daily chart, Dollar Index Spot trades at 102.10. The near-term bias is bullish as price holds above the 20-day exponential moving average (EMA) at 101.04, suggesting the recent advance remains supported by trend dynamics. The Relative Strength Index (14) at 71.92 sits in overbought territory, hinting that upside momentum is strong but increasingly stretched, which could invite bouts of consolidation or shallow pullbacks rather than an immediate reversal.
On the downside, immediate support is seen at 101.80, followed by the 20-day EMA at 101.04, where buyers would be expected to defend the broader uptrend on any retracement. Looking up, the asset aims to revisit its annual high of 102.54 posted on Monday.
(The technical analysis of this story was written with the help of an AI tool. Know more.)
Economic Indicator
FOMC Minutes
FOMC stands for The Federal Open Market Committee that organizes 8 meetings in a year and reviews economic and financial conditions, determines the appropriate stance of monetary policy and assesses the risks to its long-run goals of price stability and sustainable economic growth. FOMC Minutes are released by the Board of Governors of the Federal Reserve and are a clear guide to the future US interest rate policy.
Next release: Wed Oct 07, 2026 18:00
Frequency: Irregular
Consensus: -
Previous: -
Source: Federal Reserve
Minutes of the Federal Open Market Committee (FOMC) is usually published three weeks after the day of the policy decision. Investors look for clues regarding the policy outlook in this publication alongside the vote split. A bullish tone is likely to provide a boost to the greenback while a dovish stance is seen as USD-negative. It needs to be noted that the market reaction to FOMC Minutes could be delayed as news outlets don’t have access to the publication before the release, unlike the FOMC’s Policy Statement.
Author
Sagar Dua
FXStreet
Sagar Dua is associated with the financial markets from his college days. Along with pursuing post-graduation in Commerce in 2014, he started his markets training with chart analysis.

















