US Dollar Index climbs to five-week high as hawkish Fed bets gather pace
- The US Dollar Index heads for its first weekly gain in three weeks, supported by higher Treasury yields, strong US inflation data, and geopolitical tensions in the Middle East.
- Technically, DXY maintains a constructive near-term tone after reclaiming its key moving averages.
- Key support levels are seen at the 50-day SMA near 99.00 and the 100-day SMA around 98.48.

The US Dollar Index (DXY), which measures the Greenback against a basket of six major currencies, extends its rally on Friday, climbing to its highest level since April 8 as investors continue to favor the US Dollar (USD) amid hawkish Federal Reserve (Fed) expectations and persistent geopolitical uncertainty surrounding US-Iran negotiations.
At the time of writing, the DXY trades around 99.20, putting the index on track for its first weekly gain in three weeks. The advance comes as traders reassess the US inflation outlook following another sharp rise in both Consumer Price Index (CPI) and Producer Price Index (PPI) data released earlier this week, marking the second straight month of accelerating inflation in April.
Higher Oil prices linked to tensions in the Middle East remain a key driver of inflation. Following the latest inflation data, traders have increased bets that the Fed could raise interest rates by the end of the year, with the CME FedWatch Tool showing nearly a 50% probability of a rate hike at the December meeting.
Mounting inflation risks and tighter monetary policy expectations push US Treasury yields higher, with the benchmark 10-year Treasury yield hovering near one-year highs and supporting the US Dollar’s upward momentum.
The Greenback also finds additional support from a positive meeting between US President Donald Trump and Chinese President Xi Jinping, where both leaders discussed trade and stronger investment ties between the two countries.
Meanwhile, safe-haven demand for the Greenback remains firm as uncertainty over US-Iran nuclear negotiations persists, with President Donald Trump reiterating threats to resume military action if no agreement is reached.
Technical Analysis:
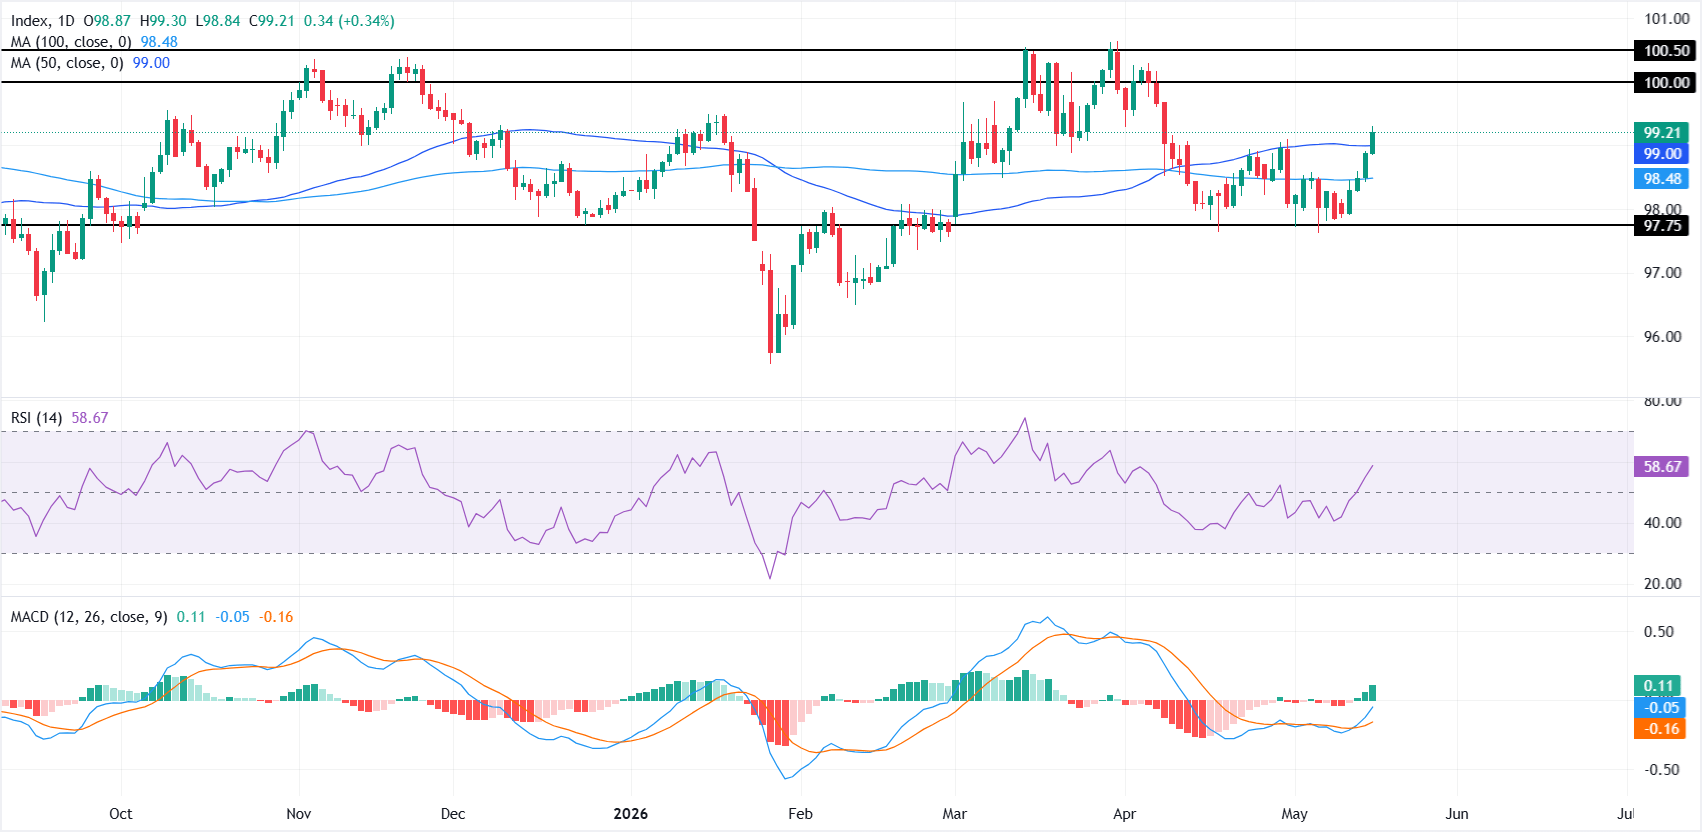
On the daily chart, the Dollar Index is extending its recovery above its main moving averages and reinforcing a constructive near-term bias. The 50-day Simple Moving Average (SMA) at 99.00 now underpins the advance, with the 100-day SMA at 98.48 offering a deeper layer of trend support.
Momentum conditions back the topside tone, as the Relative Strength Index (14) at 58.67 pushes further into positive territory and the Moving Average Convergence Divergence (MACD) turns more firmly positive above the zero line.
On the topside, initial resistance is located at 100.00, with a break there exposing the next hurdle at 100.50. On the downside, immediate support is provided by the 50-day SMA at 99.00, ahead of the 100-day SMA at 98.48; a deeper pullback would look to the horizontal floor near 97.75 as the next notable demand area.
(The technical analysis of this story was written with the help of an AI tool.)
Fed FAQs
Monetary policy in the US is shaped by the Federal Reserve (Fed). The Fed has two mandates: to achieve price stability and foster full employment. Its primary tool to achieve these goals is by adjusting interest rates. When prices are rising too quickly and inflation is above the Fed’s 2% target, it raises interest rates, increasing borrowing costs throughout the economy. This results in a stronger US Dollar (USD) as it makes the US a more attractive place for international investors to park their money. When inflation falls below 2% or the Unemployment Rate is too high, the Fed may lower interest rates to encourage borrowing, which weighs on the Greenback.
The Federal Reserve (Fed) holds eight policy meetings a year, where the Federal Open Market Committee (FOMC) assesses economic conditions and makes monetary policy decisions. The FOMC is attended by twelve Fed officials – the seven members of the Board of Governors, the president of the Federal Reserve Bank of New York, and four of the remaining eleven regional Reserve Bank presidents, who serve one-year terms on a rotating basis.
In extreme situations, the Federal Reserve may resort to a policy named Quantitative Easing (QE). QE is the process by which the Fed substantially increases the flow of credit in a stuck financial system. It is a non-standard policy measure used during crises or when inflation is extremely low. It was the Fed’s weapon of choice during the Great Financial Crisis in 2008. It involves the Fed printing more Dollars and using them to buy high grade bonds from financial institutions. QE usually weakens the US Dollar.
Quantitative tightening (QT) is the reverse process of QE, whereby the Federal Reserve stops buying bonds from financial institutions and does not reinvest the principal from the bonds it holds maturing, to purchase new bonds. It is usually positive for the value of the US Dollar.
Author

Vishal Chaturvedi
FXStreet
I am a macro-focused research analyst with over four years of experience covering forex and commodities market. I enjoy breaking down complex economic trends and turning them into clear, actionable insights that help traders stay ahead of the curve.