United States Dollar Index tumbles as NFP shock trims Fed hike bets
- DXY slides after Nonfarm Payrolls unexpectedly show 23K job losses.
- Treasury yields fall as September hike odds sink sharply.
- Focus shifts to CPI and PPI for inflation confirmation.

The US Dollar Index (DXY), which tracks the buck’s value against a basket of six currencies, is down 0.36% to 99.58 following a weaker-than-expected US jobs report. The DXY hit 99.41 after the jobs report release, its lowest level since June 15. The data has also eased pressures on the Federal Reserve (Fed) to hike rates, as inflation remains stubbornly above the Fed’s 2% goal.
DXY falls after July payrolls contracted, pushing yields lower and shifting attention to next week’s CPI
July Nonfarm Payrolls showed that the economy slashed 23K jobs from the workforce, below forecasts of an 80K jobs expansion. The figures for May and June were revised lower, with the former at 63K, down from 129K, and the latter at 20K, down from 57K. Although the report was negative, the Unemployment Rate ticked lower from 4.2% to 4.1%.
On the data, Richmond Fed Thomas Barkin said that the labor market is more low-hire, low-fire, and noted that corporate earnings “are quite strong.”
Following the data, US Treasury yields, particularly the 10-year T-note yield, fell by 3.5 basis points to 4.637%.
Fed expected to hold rates in September
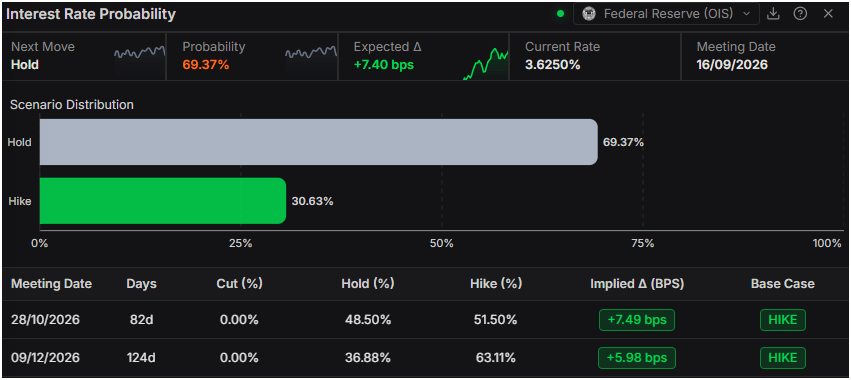
Money markets trimmed expectations for a rate hike in September. The odds of a hold reversed from around 42% to nearly 70%, while the chances of a 25-basis-point increase eased from 58% to 30%, according to Prime Terminal data.
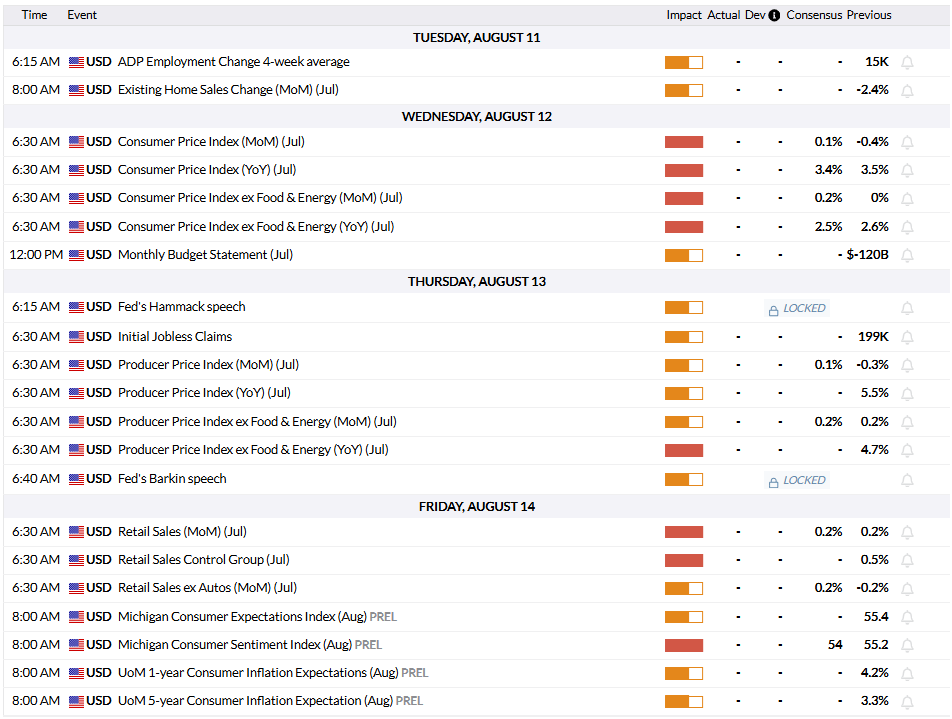
Traders' focus shifts towards the release of the US Consumer Price Index (CPI) for July next week, on Wednesday. Economists project inflation to drop from 3.5% to 3.4% YoY, and Core CPI to tick lower from 2.6% to 2.5% YoY.
A day after CPI, the Producer Price Index (PPI) is released, which is used to calculate the Fed’s preferred inflation gauge, the Core Personal Consumption Expenditures (PCE) Price Index.
Next week's US economic calendar
US Dollar Index Price Forecast: Technical outlook
In the daily chart, Dollar Index Spot trades at 99.63, retaining a bearish near-term bias as it slips below the clustered simple moving averages (SMA) pack, whose latest composite reading sits near 100.57 and now acts as overhead resistance. Price is testing the rising support trend line around 99.63, highlighting a pivotal area where a daily close lower would reinforce the downside case, while the Relative Strength Index (14) at 36.19 hovers just above oversold territory, suggesting that selling pressure is still dominant but could be nearing fatigue.
On the topside, a recovery above the SMA cluster at 100.57 would be the first signal that the downside is easing, with the descending resistance trend line break level at 101.57 acting as the next barrier and capping any stronger rebound for now. On the downside, a sustained move below the rising support trend line at 99.63 would open the door for a deeper slide, while the RSI’s position near 36.19 hints that additional losses could become progressively harder to extend even as the broader technical structure remains under pressure.
(The technical analysis of this story was written with the help of an AI tool. Know more.)
US Dollar FAQs
The US Dollar (USD) is the official currency of the United States of America, and the ‘de facto’ currency of a significant number of other countries where it is found in circulation alongside local notes. It is the most heavily traded currency in the world, accounting for over 88% of all global foreign exchange turnover, or an average of $6.6 trillion in transactions per day, according to data from 2022. Following the second world war, the USD took over from the British Pound as the world’s reserve currency. For most of its history, the US Dollar was backed by Gold, until the Bretton Woods Agreement in 1971 when the Gold Standard went away.
The most important single factor impacting on the value of the US Dollar is monetary policy, which is shaped by the Federal Reserve (Fed). The Fed has two mandates: to achieve price stability (control inflation) and foster full employment. Its primary tool to achieve these two goals is by adjusting interest rates. When prices are rising too quickly and inflation is above the Fed’s 2% target, the Fed will raise rates, which helps the USD value. When inflation falls below 2% or the Unemployment Rate is too high, the Fed may lower interest rates, which weighs on the Greenback.
In extreme situations, the Federal Reserve can also print more Dollars and enact quantitative easing (QE). QE is the process by which the Fed substantially increases the flow of credit in a stuck financial system. It is a non-standard policy measure used when credit has dried up because banks will not lend to each other (out of the fear of counterparty default). It is a last resort when simply lowering interest rates is unlikely to achieve the necessary result. It was the Fed’s weapon of choice to combat the credit crunch that occurred during the Great Financial Crisis in 2008. It involves the Fed printing more Dollars and using them to buy US government bonds predominantly from financial institutions. QE usually leads to a weaker US Dollar.
Quantitative tightening (QT) is the reverse process whereby the Federal Reserve stops buying bonds from financial institutions and does not reinvest the principal from the bonds it holds maturing in new purchases. It is usually positive for the US Dollar.
Author

Christian Borjon Valencia
FXStreet
Markets analyst, news editor, and trading instructor with over 14 years of experience across FX, commodities, US equity indices, and global macro markets.















