TSMC: Strong earnings meet a tougher test on AI investment returns

TSMC’s latest results support confidence in its business, but the shares need evidence that rapid capacity expansion can sustain attractive returns. At approximately $420.95 on the chart, the outlook is cautiously constructive, with near-term price weakness contrasting with strong reported earnings.
Earnings support the business case
Third-quarter revenue reached $46.72 billion, increasing 41.2% year on year in US dollars. Operating profit rose 75% in Taiwan dollars, while diluted earnings reached $4.60 per ADR.
The improvement reflects strong demand for advanced manufacturing. Processes of 7nm and below generated 79% of wafer revenue, while high-performance computing accounted for 68% of total revenue. These categories overlap and should not be interpreted as measures of AI revenue.
However, profitability softened sequentially. Gross margin declined from 67.7% to 66.4%, primarily because of the initial 2nm production ramp. Operating margin fell from 60.3% to 58.7%.
The implication is straightforward as demand remains strong, but expanding production is becoming more expensive. Further earnings growth increasingly depends on manufacturing efficiency and factory utilization.
Cash generation makes expansion affordable
TSMC’s investment case remains constructive as demand is strong, profitability is exceptional and cash generation supports expansion. However, future growth depends on how quickly capital spending becomes productive capacity and the returns that capacity earns.
Scarcity supports TSMC’s competitive position but also limits shipments and raises the cost of capturing future demand.
Financial indicator | Q3 2026 result | Investment interpretation |
Revenue | US$46.72 billion; +41.2% annually | Strong demand translated into substantial growth |
Net income | NT$763.06 billion; +68.7% annually | Earnings grew faster than revenue |
Gross margin | 66.4%, versus 67.7% in Q2 | Expansion is already creating cost pressure |
Operating margin | 58.7% | Profitability remains exceptionally strong |
Earnings per ADR | US$4.60 | Strong quarterly earnings; one quarter should not be mechanically annualized |
Management’s fourth-quarter revenue guidance of US$52.3–54.3 billion implies approximately 14% sequential growth at the midpoint. However, gross-margin guidance of 65–67% indicates that faster sales growth will coexist with expansion costs.
Earnings quality supports the thesis. Third-quarter operating cash flow reached NT$919.77 billion, comfortably exceeding capital expenditure of NT$443.21 billion. Free cash flow was NT$476.56 billion, while net cash reserves reached NT$2.99 trillion. Financing therefore appears less restrictive than the physical execution of expansion.
The main operational constraint is advanced wafer capacity. Management described a substantial demand–supply gap and tight equipment availability. New factories need specialized tools, qualifications and successful production ramps before they generate saleable chips. TSMC expects annual 2nm capacity to more than double in 2027, illustrating both the opportunity and the execution required.
Advanced packaging adds another dependency. CoWoS connects processors and high-bandwidth memory into computing packages; wafer and packaging capacity must expand together. However, management’s latest comments do not establish CoWoS as the single largest bottleneck.
This changes how traders should interpret scarcity. Unmet demand represents potential revenue rather than guaranteed near-term earnings. Scarcity can strengthen pricing power, but equipment delays or slower production ramps can postpone shipments. When capacity eventually arrives, customers must still require - and be able to deploy - the additional output.
Capital expenditure consequently deserves as much attention as revenue guidance. TSMC maintained its US$60–64 billion annual capital budget. Against US$40.64 billion spent through September, that implies approximately US$19.4–23.4 billion in fourth-quarter spending. The recent improvement in free cash flow should therefore not be extrapolated mechanically.
The accounting sequence matters. Capital expenditure reduces cash flow immediately; depreciation affects earnings after assets enter service. A strong quarter can therefore precede heavier depreciation and start-up costs. Management attributed the sequential gross-margin decline primarily to the initial 2nm ramp and expects continued pressure from 2nm and overseas factories.
For traders, the following developments would distinguish productive expansion from increasingly expensive growth:
Scenario | Evidence to monitor | Trading implication |
Main: growth absorbs expansion costs | Revenue meets guidance, capacity ramps on schedule and margins remain within guidance | Supports a constructive medium-term view; favour entries with price confirmation |
Bullish: capacity converts into earnings faster | Revenue exceeds expectations alongside resilient margins and stronger cash conversion | Creates scope for upward earnings revisions |
Alternative: costs rise faster than output | Ramp delays, revenue disappointment or margins below guidance | Weakens the bullish thesis and increases downside repricing risk |
Demand deterioration | Customer deployment delays, weaker orders or falling utilization | Raises the risk that today’s shortage becomes tomorrow’s excess capacity |
These fundamental conditions need to be assessed alongside valuation. Strong operating performance can still produce disappointing share returns if the market already discounts successful execution.
Valuation depends on earnings delivery
At the price chart, TSMC trades at approximately 27 times trailing earnings. Its forward valuation appears considerably lower because analysts anticipate substantial additional profit growth.
That creates a vulnerability: an apparently inexpensive forward multiple can become expensive if earnings forecasts fall.
The following are illustrative valuations based on independent 2027 assumptions, not company guidance or guaranteed price targets.
Scenario | Fundamental assumptions | ADR EPS estimate | P/E assumption | Indicative value |
Bear | Slower demand, weaker utilization and margin compression | $17.08 | 20× | $342 |
Base | Continued growth with manageable expansion costs | $20.67 | 24× | $496 |
Bull | Strong capacity absorption and sustained premium profitability | $24.13 | 28× | $676 |
The base case suggests approximately 18% upside from $420.95, compared with approximately 19% downside in the operating bear case. This balance supports selectivity rather than an unconditional bullish stance. Severe geopolitical disruption could produce losses beyond these scenarios.
Trading scenarios
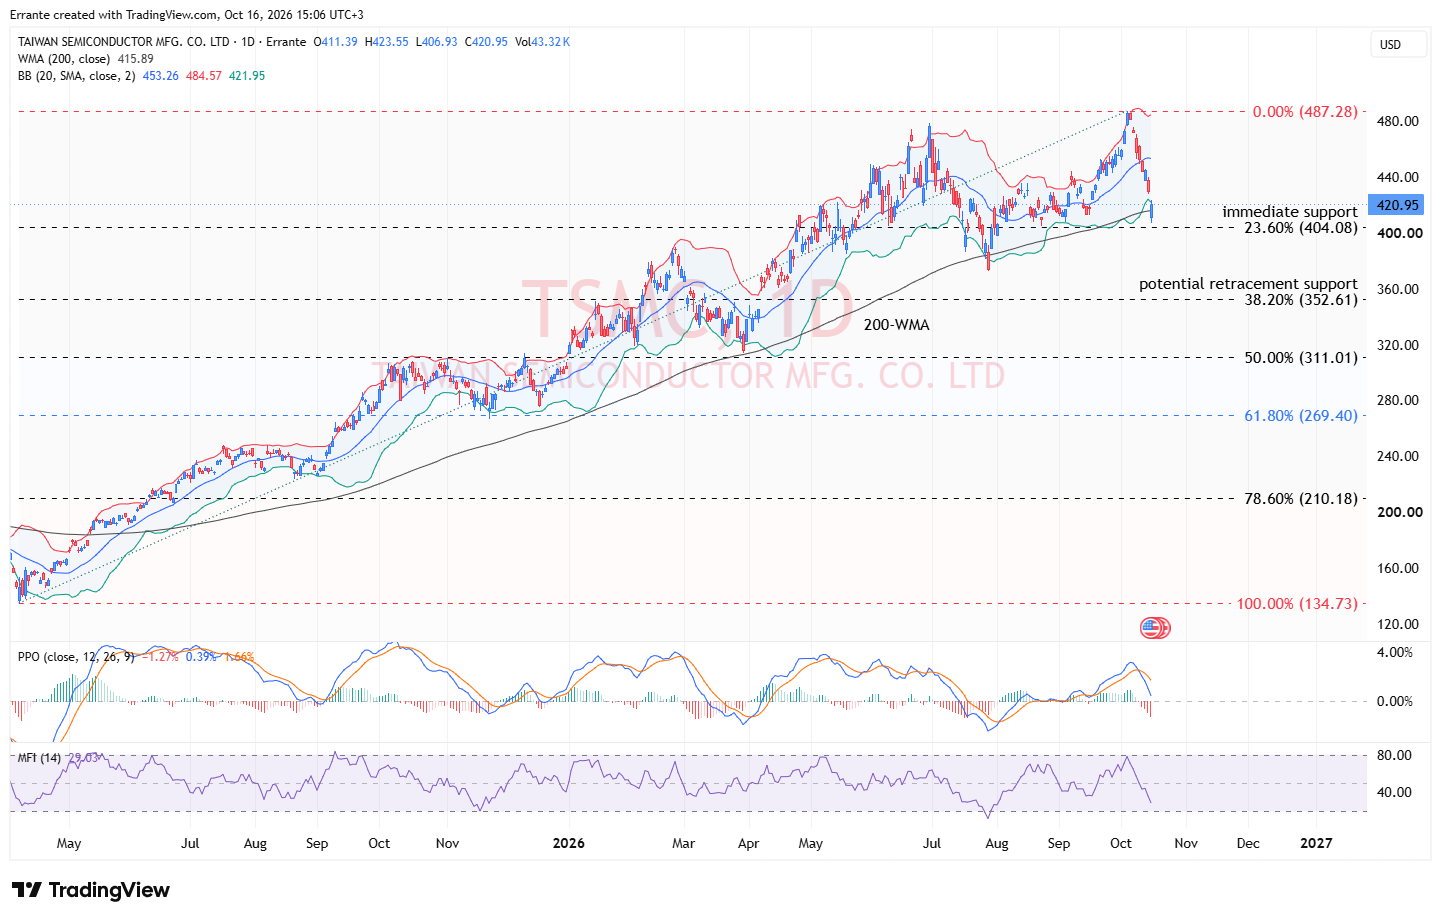
Price has retreated sharply from $487.28 and is testing the rising 200-day weighted moving average near $415.89, above Fibonacci support at $404.08.
Scenario | Fundamental confirmation | Technical trigger | Implication |
Main: stabilization and recovery | Revenue remains consistent with guidance; margin pressure stays manageable | Defends $404–$416, then reclaims $453.26 | Strengthens the recovery case toward $487.28 |
Alternative: prolonged correction | Customer spending concerns intensify or earnings expectations decline | Sustained daily break below $404.08, followed by a failed recovery | Exposes $352.61 |
Support holding alone would establish only price stabilization. A more convincing recovery requires buyers to reclaim resistance alongside improving confidence in future earnings.
Conclusion
The constructive case rests on three conditions: customers maintain spending, new capacity reaches efficient utilization, and margins stabilise despite overseas expansion. If those conditions hold, earnings growth can justify a recovery.
For traders, $404–$416 is the immediate decision zone, while $453 is the stronger recovery test. Until price confirms that improvement, strong financial statements support the long-term thesis but do not establish that the correction has ended.
Author

Ali Mortazavi
Errante
BEc, CMSA, Member of IFTA - International Federation of Technical Analysis, Associate Member of STA - Society of Technical Analysis (UK).

















