TRV could be setting up for a pullback

Travelers (TRV) enters the next quarter with solid momentum after beating Q1 earnings. Analysts expect EPS near 4.84 and revenue around $10.97B, showing stable demand despite mild growth pressure. Moreover, recent product expansions and AI‑driven claims tools suggest stronger operational efficiency. These improvements could support underwriting margins in the short term.
However, expectations remain cautious because EPS will likely drop from last year’s unusually strong quarter. Still, analysts project steady full‑year earnings near $28.14 per share, which signals confidence in TRV’s core business. As the July 17 earnings date approaches, investors will watch loss trends, pricing strength, and catastrophe exposure. These factors will shape the stock’s direction in the coming months.
Elliott Wave outlook: TRV weekly chart January 2026
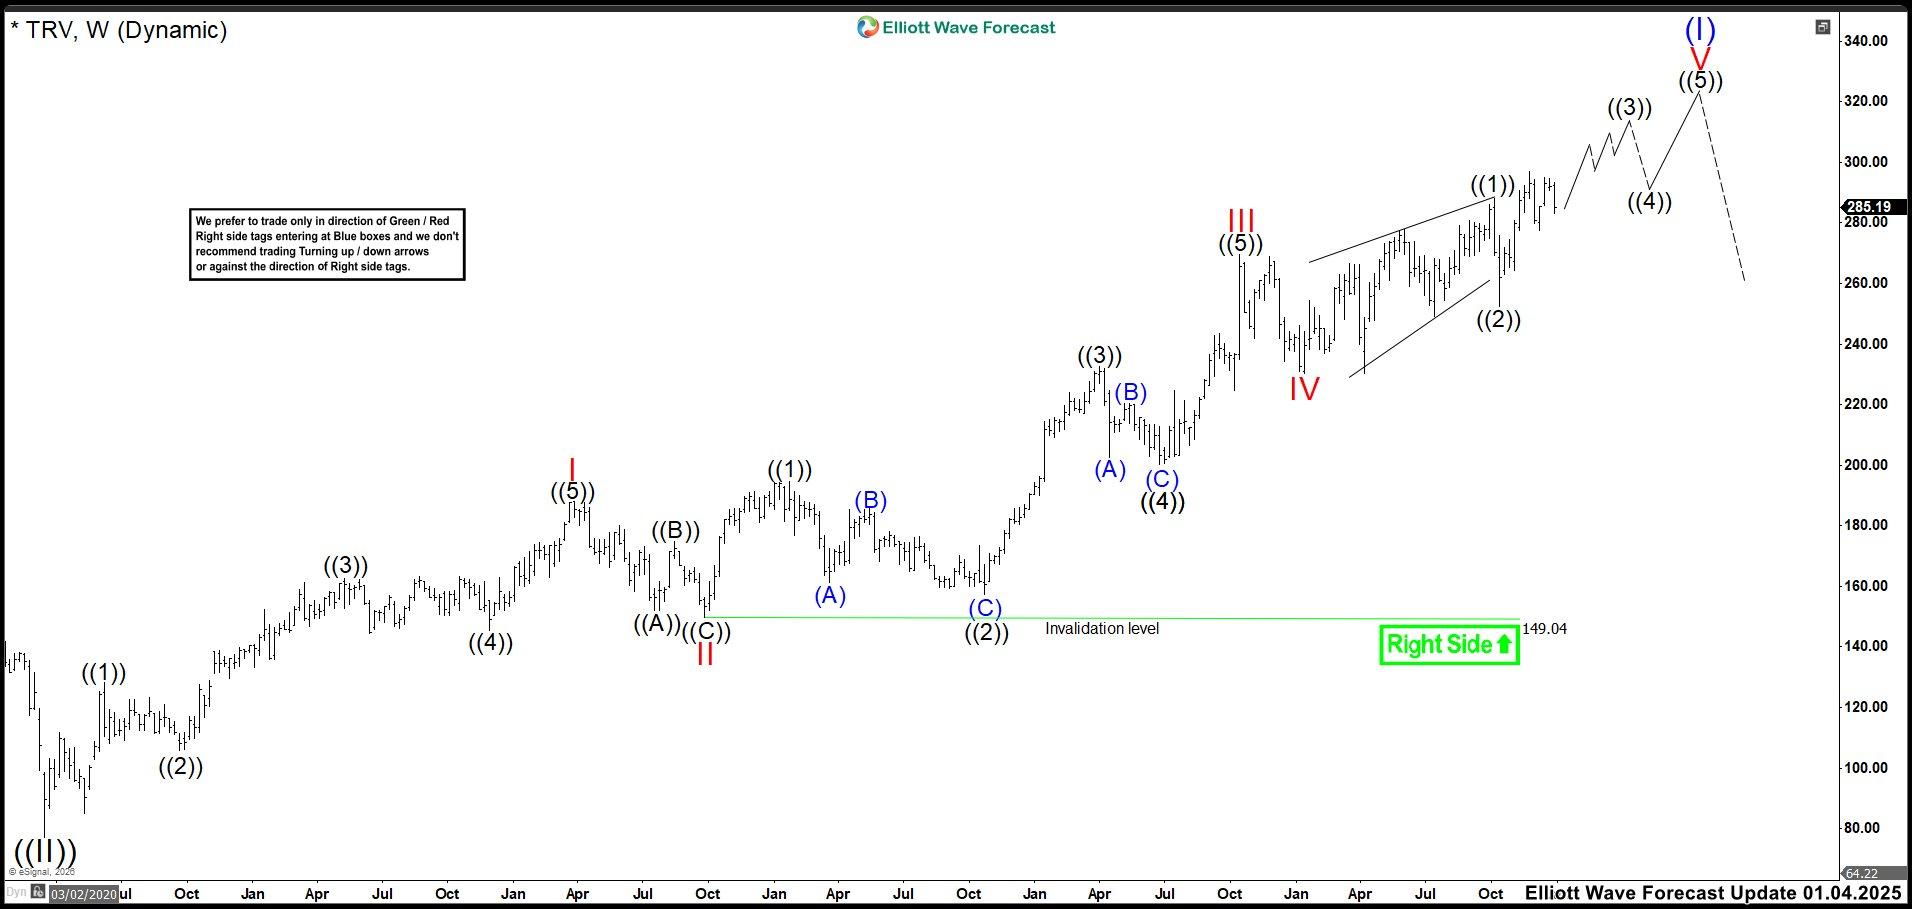
In the last TRV update, the market completed the diagonal and reacted lower as expected. However, that decline turned out to be only a correction because the market quickly broke to new highs. This shift meant the move from the wave IV low formed a leading diagonal, which we labeled as wave ((1)). The October decline corresponded to wave ((2)), and price was trading in wave ((3)) of V.
Therefore, we expected more upside to complete wave ((3)) and eventually finish the impulse of wave V. Even so, there was still a chance that wave V was unfolding as an ending diagonal. This depended on how high wave ((3)) could reach and how deep the pullback in wave ((4)) would become. If wave ((3)) failed to create enough upward separation and wave ((4)) produced a deep correction without breaking below the wave ((2)) low, then the structure remained an ending diagonal. This scenario still supported more upside, although with a less aggressive path.
Elliott Wave principle behind the market structure
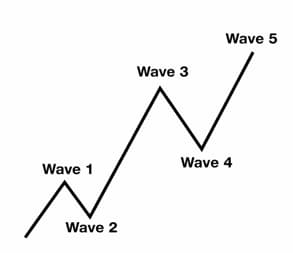
Impulse
An impulse is a clean 5‑wave pattern that drives the trend forward.
- Waves 1‑3‑5 are strong and directional.
- No overlap between waves 1 and 4.
- Wave 3 is usually the strongest.
- Structure is clear, with increasing momentum.
Elliott Wave outlook: TRV weekly chart May 2026
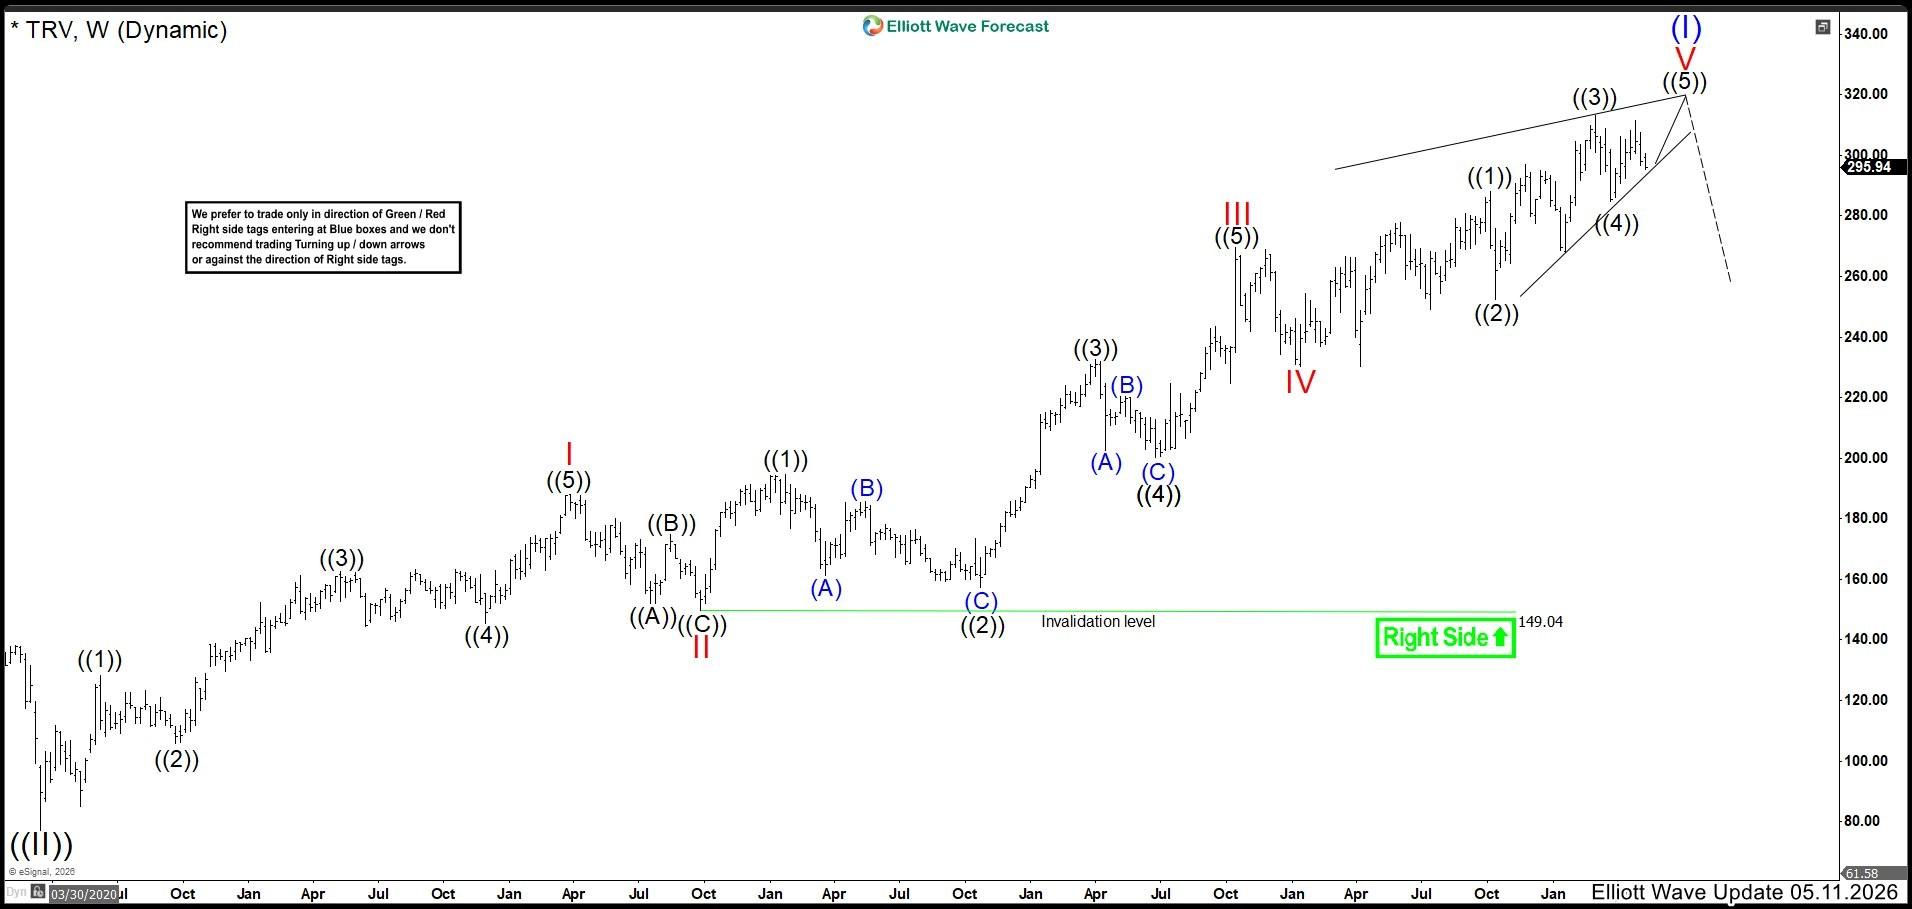
In this new update, we see the market holding higher but without enough separation to confirm wave ((3)). Instead, TRV still appears inside an ending diagonal for wave V. Until price breaks strongly higher, the market keeps rising but loses momentum, suggesting a possible correction soon.
For now, the ideal structure calls for one more high to complete the ending diagonal and start a deeper correction. However, this idea changes if the market delivers a strong bullish move. That surge would revive the cycle and extend prices higher without a near‑term correction.
Author

Elliott Wave Forecast Team
ElliottWave-Forecast.com
















