Tokyo has hitched itself to Seoul’s AI rollercoaster
- Japan has reduced its dependence on US broad-market beta, but replaced it with a much tighter link to Seoul’s semiconductor and memory cycle.
- The KOSPI’s repeated market-wide halts point to a more reflexive system, where leveraged single-stock ETFs and margin dynamics can turn routine selling into index-level stress.
- The Nikkei-to-TOPIX ratio at 18 times shows Tokyo splitting between a concentrated AI hardware trade and a broader domestic reform story.
- The AI capex thesis may remain intact, but investors need to separate being bullish on the destination from being complacent about the ride.
Japan is the true Korean butterfly effect
This is truly outstanding work from Goldman managing director and trader John Joyce. The key highlights are excerpted below with a Dark Side of the Boom take.
Japan finally broke up with Wall Street. Or at least it stopped dancing to every move in New York markets.
In June, the Nikkei’s correlation with the S&P 500 fell to 0.26, leaving just 6.8% of its performance statistically explained by the S&P 500's beta. For a market that spent years behaving like an offshore extension of the US markets, that is a meaningful break.
But markets rarely reward independence for long. Japan did not leave the party. It simply changed tables.
The Nikkei has become increasingly tethered to Seoul, with its correlation to the KOSPI climbing to 0.84, more than twice the historical average. Tokyo and Seoul are now being traded less as separate countries and more as two listed expressions of the same global AI hardware buildout.
Tokyo brings Kioxia, Tokyo Electron and Advantest. Seoul brings Samsung and SK Hynix. Put them together and investors have built a North Asian semiconductor complex: one part memory, one part tools, one part testing, all geared to the same data-centre spending cycle.
The fundamental case is not hard to understand. AI capex remains immense, the physical buildout is still occurring, and earnings revisions continue to push higher. The issue is no longer whether the story is real. It is that the structure of the trade is starting to resemble a crowded escalator: fine while everyone is moving in the same direction, dangerous when somebody turns around.
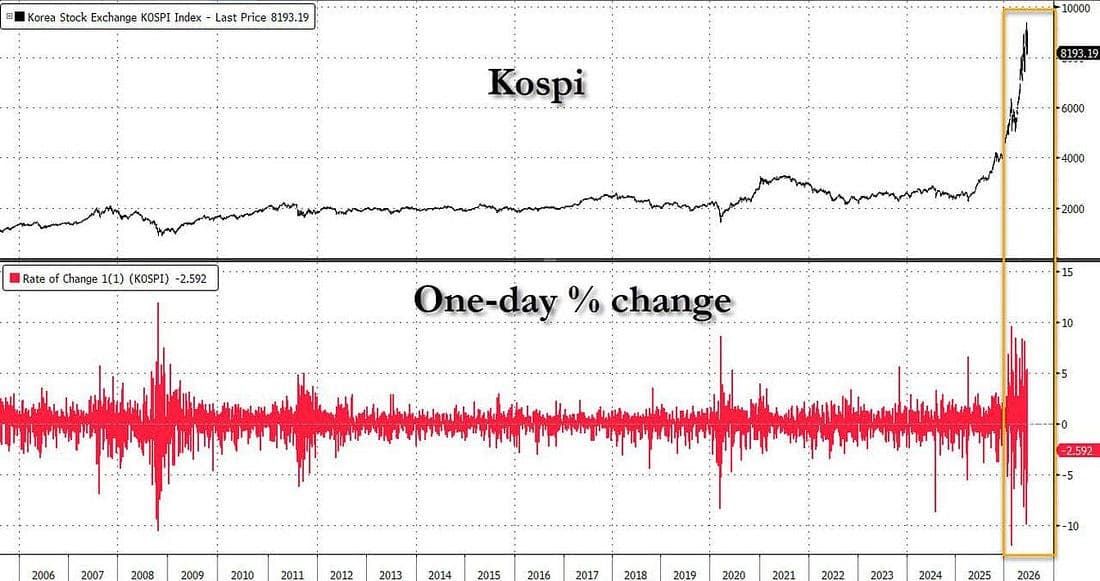
South Korea has now triggered five market-wide trading halts in 2026. That compares with only eleven since the circuit-breaker framework began in 2000. Nearly half of all such full-market interruptions this century have occurred in a single year.
That is not just sentiment running hot. It is a market structure revealing itself under stress.
The rise of highly leveraged single-stock ETFs linked to Samsung and SK Hynix has created an increasingly reflexive system. When the shares rise, leveraged inflows add fuel. When prices soften, the same vehicles amplify the reversal, forcing de-risking into a market already dominated by the largest AI and memory names.
It is less a conventional equity market than a flywheel that spins faster the longer it is left unattended.
The week of June 22 showed how quickly that flywheel can reverse.
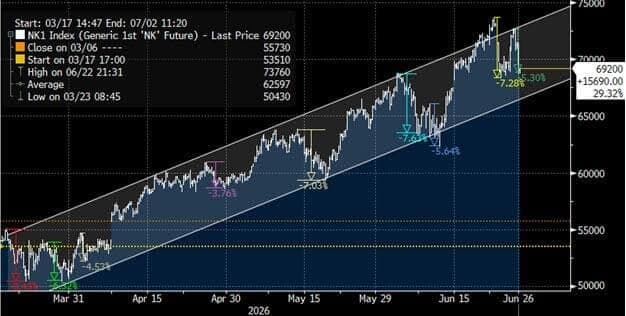
Last Monday, AI optimism was still in full bloom. The Nikkei reached a record high of 72,353.96, while the KOSPI moved above 9,100. By Tuesday, the leverage started coming out. The KOSPI fell 9.99%, tripping a circuit breaker, while the Nikkei dropped 3.55% in sympathy.
Then, by Friday, selling returned with a more pronounced downstream margin effect. The KOSPI triggered its fifth circuit breaker of the year and closed down 5.81%. The Nikkei fell 4.15%.
The lesson was not that Japan and Korea are identical. They are not. The lesson is that the marginal buyer and seller increasingly treat them as parts of the same hardware complex. When the memory cycle catches a cold in Seoul, Tokyo now reaches for the tissues.
That dependency is also changing the internal architecture of Japan’s own market.
The Nikkei-to-TOPIX ratio reached 18 times intraday, an extraordinary move for a relationship that has traditionally been low-volatility and mean-reverting. From 14.52 times on April 3, the ratio has surged 24% in less than three months, the fastest expansion in its history.
The trade is right, but the ETF footprints are a mess
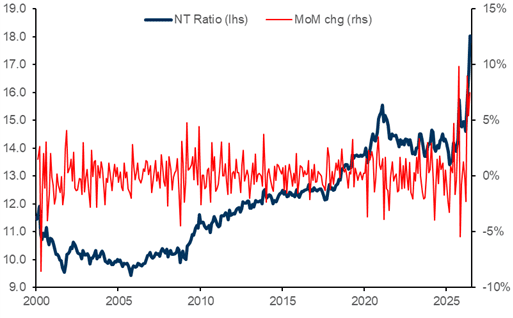
For context, the famous 1999 to 2001 contraction in the ratio saw about a 30% decline, but it took roughly three years to play out. This move has happened in one quarter. That is not a gentle rotation. It is a market choosing one narrow lane and accelerating into it.
There are now two Japans trading side by side.
The broader TOPIX still reflects domestic rate normalization, corporate governance reform, and a more traditional cyclical recovery. The Nikkei, by contrast, has become a price-weighted high-beta proxy for the global semiconductor complex. It is increasingly less about Japan Inc. and more about the next turn in memory pricing, AI capex and the leverage wrapped around those trades.
That distinction matters for investors because the macro thesis and the market vehicle are no longer the same thing.
You can remain constructive on the AI hardware cycle, believe the earnings story has further to run and still recognise that the Nikkei is importing a much more violent form of volatility from Seoul. The secular trend may be intact, but the path is no longer smooth enough to mistake for a one-way trade.
The KOSPI has become the pressure chamber of the North Asian AI complex. Japan is not trapped inside it, but it is now close enough to feel every release of steam.
Author

Stephen Innes
SPI Asset Management
With more than 25 years of experience, Stephen has a deep-seated knowledge of G10 and Asian currency markets as well as precious metal and oil markets.